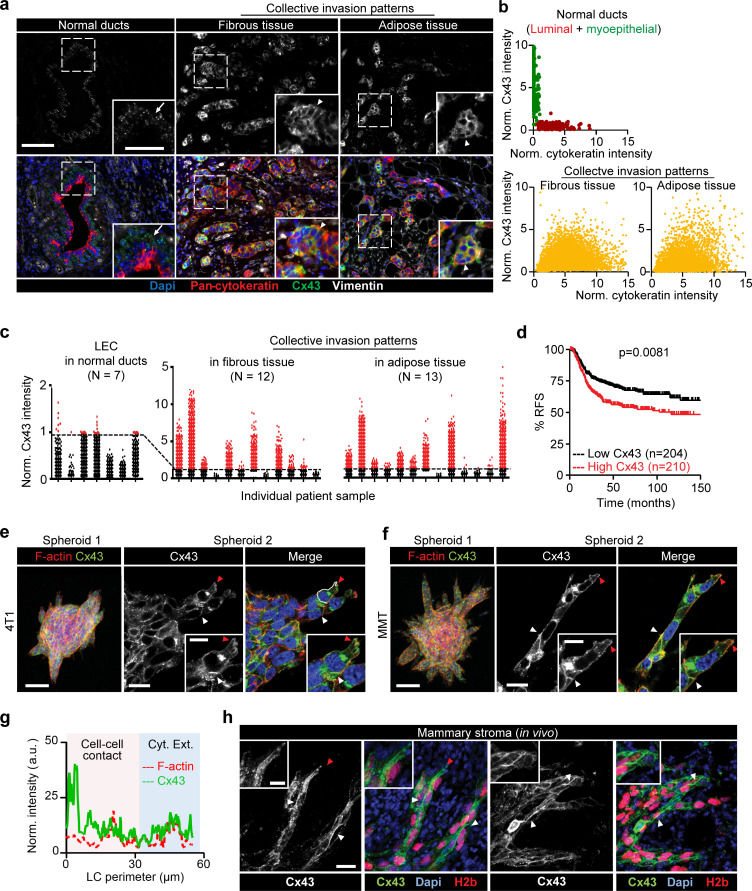
Figure 1.
Increased expression of Cx43 in breast cancer cells during collective cancer cell invasion in vivo and in vitro. (a) Multispectral microscopy of breast cancer tissue sections stained for Cx43 (green), pan-cytokeratin (red; epithelial cells), vimentin (white; stromal cells, cancer cells after epithelial-to-mesenchymal transition). The three panels represent example slices for normal ducts and the invasion zones in the collagen-rich fibrous or adipose tissue. Detection of Cx43 in myoepithelial cells surrounding the luminal epithelium and epithelial cancer cells along cell–cell junctions. Arrows and arrowheads depict Cx43 at cell–cell contacts with puncta or linear patterns, respectively. (b) Colocalization analysis of Cx43 versus pan-cytokeratin expression and classified myoepithelial cells, luminal epithelial cells, and invading cancer cells in fibrous or adipose tissue. Cx43 and pan-cytokeratin levels were acquired using supervised automated tissue segmentation software (Inform). (c) Cx43 levels in luminal epithelium cells (LEC) and cancer cells within the fibrous or adipose tissue from 13 clinical samples (see Table 1 for sample details). Dotted line represents the threshold level for Cx43 negativity, determined by receiving operator characteristic (ROC) analysis with intensity values obtained from the luminal epithelial cells as control. (d) Kaplan–Meier survival plot predicting RFS for high versus low Cx43 expression in basal-type breast cancer patients (Györffy et al., 2010). P values, log-rank test. (e and f) Distribution of Cx43 along cell–cell junctions (white arrowheads) and at the polar extensions (red arrowheads) of leader cells during collective invasion of 4T1 (e) and MMT (f) spheroids in 3D collagen. (g) Intensity distribution of Cx43 and F-actin along the circumference of a leader cell (LC; e, white dashed border). Values show the pixel intensity with background subtraction. Confocal images are displayed as maximum-intensity projections from a 3D confocal stack. (h) Cx43 expression and distribution during collective invasion of 4T1 cells in the stroma of the mouse mammary gland, 4 d after implantation and monitored by confocal microscopy. Scale bars: 100 µm (a, e, and f, overview), 50 µm (a, inset), 20 µm (e and f, spheroid 2; h), 10 µm (e, f, and h, inset). Cyt. Ext., cytoplasmic extension. Norm, normal.

