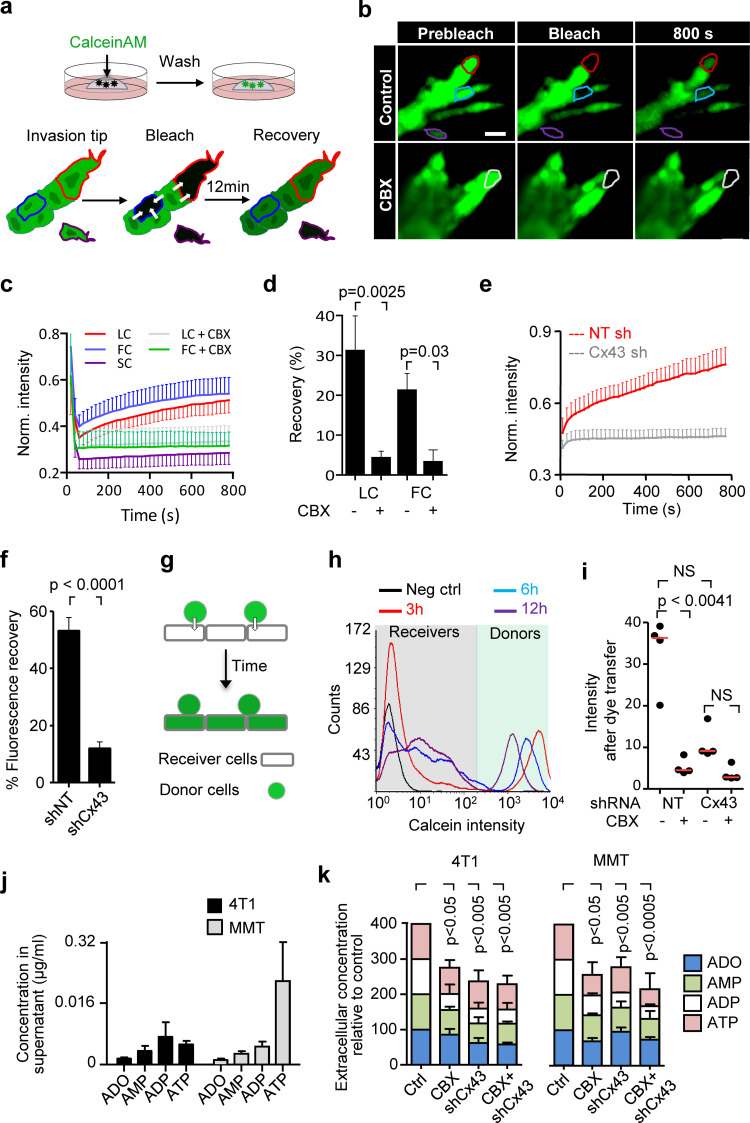
Figure 2.
Cx43 mediates GJIC and extracellular release of nucleotides/nucleosides during collective invasion. (a) Workflow of time-resolved 3D gap FRAP, including calcein labeling of multicellular spheroids in 3D collagen cultures and 3D gap-FRAP procedure of leader and follower cells within a 3D invasion strand by asymmetric region of interest selection and photobleaching, followed by recording the change in fluorescence intensity over time. (b) Single confocal slices of calcein-labeled invasive 4T1 strands before and after photobleaching. Dashed contours represent the bleached leader cell (LC; red), FC (blue), and SC (purple) in control media and LC in the presence of CBX (white). (c) Normalized calcein fluorescence intensity in bleached LCs, FCs, and SCs in the presence or absence of CBX. Values represent normalized mean fluorescence intensities with SEM; 11–16 cells per treatment condition from four independent experiments. (d) Effect of CBX on percentage fluorescence recovery after photobleaching of LCs and FCs. Values are represented as the means and SEM of three independent experiments. P values, two-tailed unpaired Mann–Whitney test. (e) Average fluorescence recovery in cells stably expressing control vector (shNT) or Cx43 shRNA (shCx43) during invasion in 3D collagen. Values represent the normalized mean intensities and SEM of four leader cells for shNT and pooled two leader cells and two follower cells for shCx43 condition. (f) Inhibition of fluorescence recovery of MMT cells after Cx43 down-regulation (cell groups in Petri dish culture). Normalized mean intensity and SEM of 19–22 cells from three independent experiments. P value, two-tailed unpaired Mann–Whitney test. (g and h) Parachute assay to measure de novo junction formation (g) followed by dye transfer into nonlabeled cells (h) and example histograms obtained by flow cytometry showing the time-dependent alterations of calcein label in donor and recipient cells. (i) Intensity of calcein in 4T1 receiver cells after 12 h of incubation with 4T1 donor cells in control conditions and during inhibition with CBX or after Cx43 down-regulation. Median (red line) intensities from four independent experiments. P values, Kruskal-Wallis test with Dunn’s multiple comparison test. (j and k) HPLC analysis of purines released from 4T1 and MMT spheroids into the supernatant after 24 h of invasion in 3D collagen. Values represent average concentrations of each purine (j) and the relative change of the total purine concentrations after treatment with CBX and/or Cx43 down-regulation in 4T1 and MMT cells (k). Mean values and SEM from four (j) or SD from three (k) independent experiments. P values, ANOVA Dunnett’s multiple comparison test. Scale bar: 20 µm (b). Neg ctrl, negative control; Norm., normalized; FC, follower cell; LC, leader cell; SC, single detached cell.

