Figure 3.
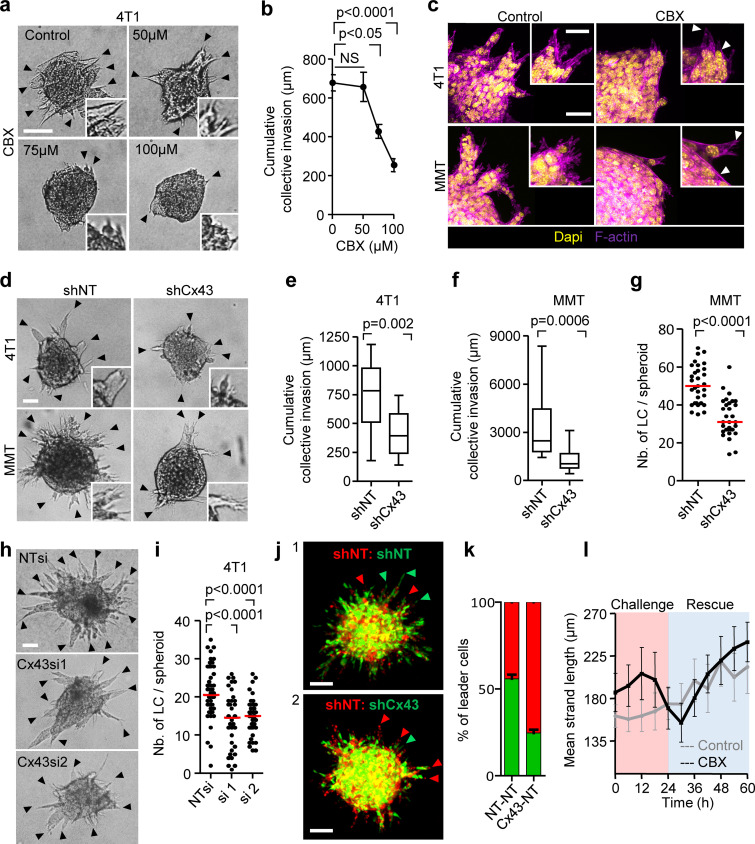
Cx43 dependence of leader cell function. (a) Bright-field images of 4T1 spheroids after 24 h of invasion in 3D collagen in the presence of increasing concentration of CBX. Arrowheads, tips of invasion strands. (b) Mean cumulative length of collective invasion strands in response to CBX. Mean values and SEM from three independent experiments each comprising seven spheroids/condition. P values, Kruskal–Wallis test with Dunn’s multiple comparison test. (c) Maximum intensity projection from a confocal 3D stack, showing F-actin and DAPI in control and CBX-treated spheroids (100 µM). (d–g) Cx43-dependent collective invasion. Bright-field images (d), cumulative collective invasion (e and f), and leader cell initiation (g) of spheroids composed of 4T1 or MMT cells stably expressing Cx43 or nontargeting shRNA (NT). Values represent the medians (black line), 25th/75th percentiles (box) and maximum/minimum (whiskers) from three or four independent experiments with three to eight spheroids each. P values, two-tailed unpaired Mann–Whitney test. (h) Bright-field images of 4T1 spheroids in response to transient Cx43 down-regulation using two different Cx43 RNAi probes. (i) Number of leader cells (LCs) per spheroid. P values, Kruskal–Wallis test with Dunn’s multiple comparison test. (j) Maximum intensity projection from a confocal 3D stack showing mosaic spheroids composed of fluorescence-coded MMT cells stably expressing NT or Cx43 shRNA as indicated (1:1 ratio); arrowheads depict red or green leader cells. (k) Frequency of green or red leader cells. Bars represent the mean values and SEM pooled from one (j1) and three (j2) independent experiments. (l) Effect of CBX on the kinetics of established invasion strands. Mean length per invasion strand after addition of CBX at 0 h (intervention) and washout at 24 h (rescue). Data show the mean values and SEM from six to eight invasion strands from one spheroid per condition. Scale bars: 100 µm (a), 50 µm (c, d, and h), 25 µm (c, inset). LC, leader cell.

