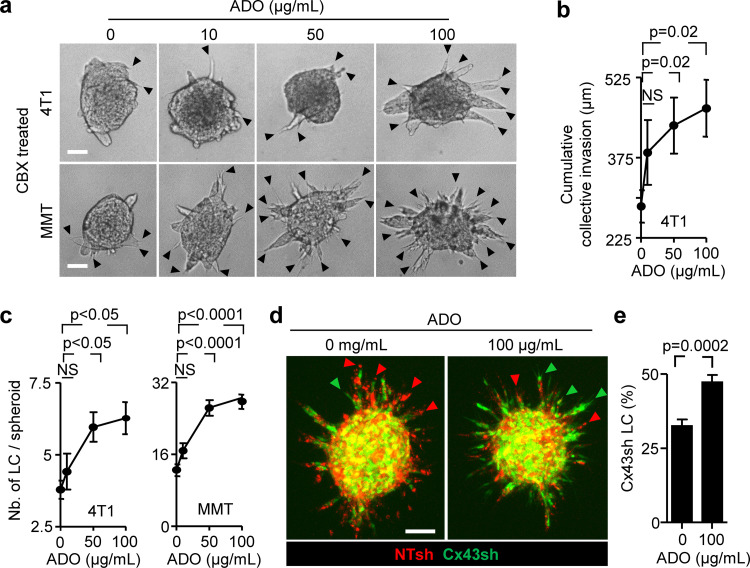
Figure 4.
Cx43 hemichannel function in leader cell induction by purine nucleotide release. (a–c) Rescue of invasion in 4T1 and MMT spheroids in 3D collagen in the presence of CBX and escalating doses of ADO; for comparison with untreated baseline levels refer to Figs. 3 b and S3 (c and e). Representative bright-field images (a), cumulative collective invasion (b), and number of leader cells (LC) per spheroid (c). Mean values and SEM from four independent experiments, each comprising 5–11 spheroids/condition. P values, Kruskal–Wallis test with Dunn’s multiple comparison test. (d and e) Rescue of leader cell deficiency after Cx43 down-regulation by exogenous ADO. (d) Maximum intensity projection from a 3D confocal stack showing mosaic spheroids with MMT cells stably expressing NT or Cx43 shRNA (1:1 ratio) in the absence or presence of ADO and (e) frequency of LC with green color expressing Cx43 shRNA. Bars represent the means and SEM from three independent experiments, each comprising three to six spheroids. P values, two-tailed unpaired Mann–Whitney test. Scale bars: 50 µm (a), 100 µm (d).

