Figure 5.
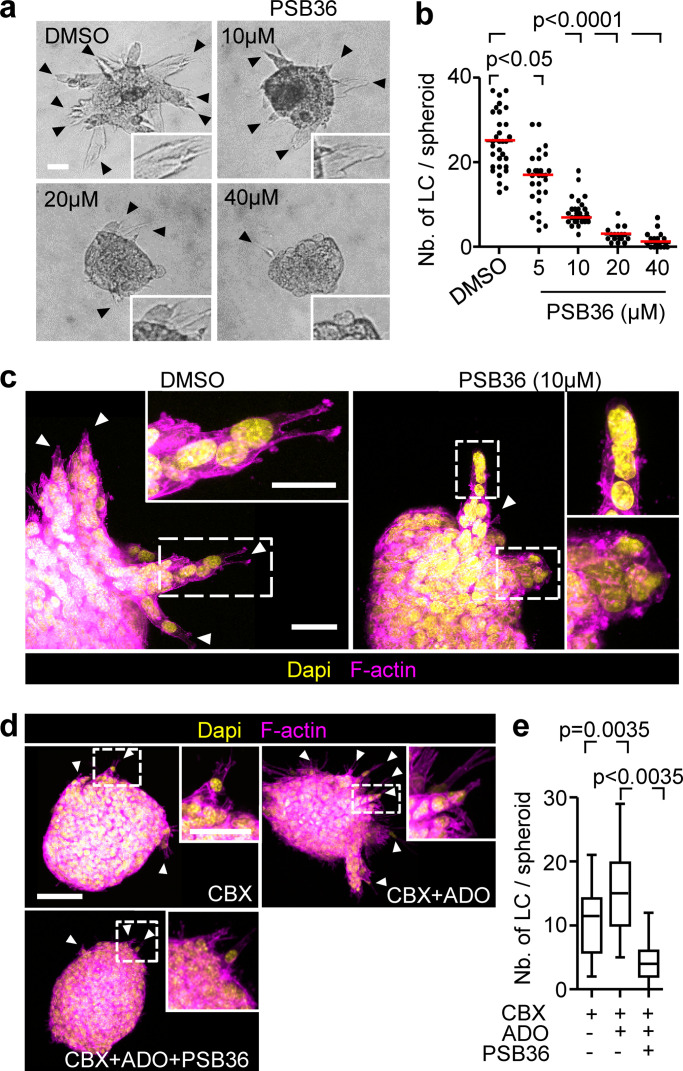
Autocrine purinergic receptor signaling maintains leader cell functions. (a) Bright-field images of 4T1 spheroids cultured in 3D collagen for 24 h in the presence of escalating concentrations of PSB36. (b) Median numbers of leader cells (LC) per spheroid (red line) from three independent experiments. P values, Kruskal–Wallis test with Dunn’s multiple comparison test. (c) Maximum intensity projection from a 3D confocal stack of 4T1 spheroid in the presence or absence of PSB36. Arrowheads, leading extensions of individual LCs. (d) Maximum intensity projections of 3D MMT spheroids with different treatments and (e) resulting number of leader cells per spheroid. Data represent the medians (black line), 25th/75th percentiles (boxes) and maximum/minimum values (whiskers) from two independent experiments each comprising 10 to 16 spheroids/condition. P values, ANOVA with Bonferroni multiple comparison test. Scale bars: 50 µm (a and d), 20 µm (c), 25 µm (d, inset), 10 µm (c, inset).

