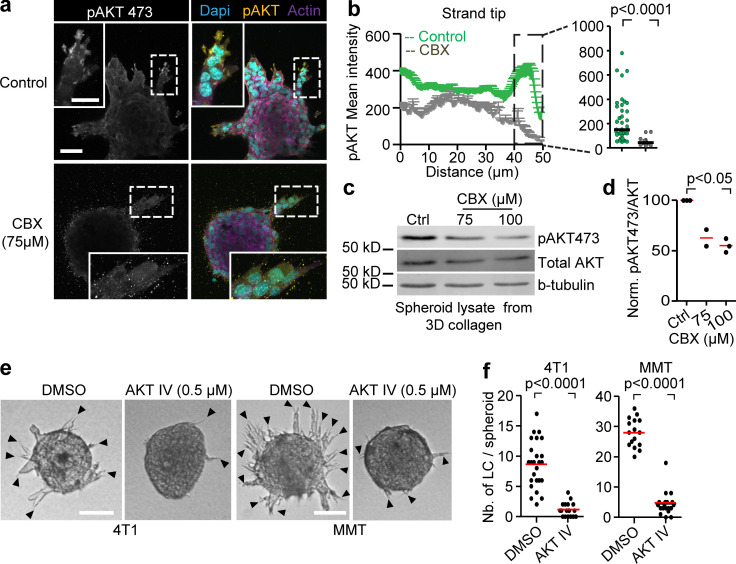
Figure 6.
AKT regulation and requirement for leader cell function and invasion. (a) Maximum intensity projection of phospho-AKT473 and F-actin staining in MMT spheroids treated with vehicle control or CBX. Maximum intensity projection of 3D confocal stack. (b) Distribution of phospho-AKT473 along protrusions of leader cells in both conditions with dot plot comparing phospho-AKT473 levels in the last 10 µm of leader cell protrusions in vehicle- and CBX-treated condition. Line graphs and dot plot represent intensities of phospho-AKT473 from 11 (control) or 21 (CBX) leader cells from three or four spheroids per respective condition. P values, two-tailed unpaired Mann–Whitney test. (c) Western blot for phospho-AKT473, AKT and β-tubulin as loading control. Whole-cell lysates extracted from MMT spheroids after 24 h of invasion into 3D collagen in the presence of 0, 75, and 100 µM of CBX. (d) Values represent normalized intensities of phospho-AKT473/total AKT with median values (red line) from two (75 µM) or three independent experiments (0 and 100 µM). P value, Kruskal–Wallis test with Dunn’s multiple comparison test. (e) Bright-field images of 4T1 and MMT spheroids embedded in 3D collagen for 15 h in the presence of DMSO or AKT inhibitor IV. (f) Number of leader cells (LC) per spheroid; red line represents the median value from 18 to 25 spheroids (4T1) and 16–19 spheroids (MMT) pooled from two independent experiments. P values, two-tailed unpaired Mann–Whitney test. Scale bars: 50 µm (a), 25 µm (a, inset), 100 µm (e).

