Figure 7.
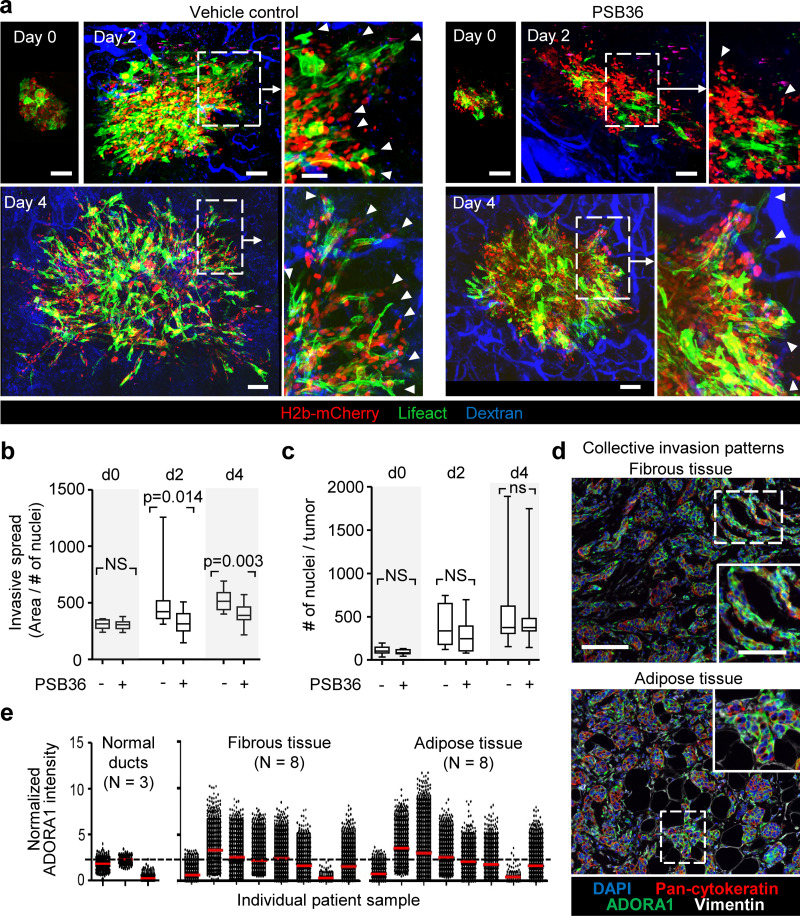
Pharmacological interference with ADORA1 inhibits collective invasion in vivo. (a) Invasion of 4T1 dual-color cells (H2B/mCherry; LifeAct/YFP) from microtumors implanted into the mouse mammary fat pad and imaged by multiphoton microscopy through a mammary window at days 0, 2, and 4 after implantation. Mice were treated with DMSO (vehicle) or 30 mg/kg PSB36 via intraperitoneal injection. Arrowhead, tip of collective invasion strand. (b and c) Analysis of invasion as the average area covered by the lesion normalized to the number of nuclei (b) and the tumor growth expressed as number of cells per lesion (c). Data in b and c represent the medians (black line), 25th/75th percentiles (boxes), and maximum/minimum values (whiskers) from at least nine implanted tumors from four independent experiments. P values, two-tailed unpaired Mann–Whitney test. (d) Detection of ADORA1 in fibrous or adipose tissue invasion zones of breast cancer samples using multispectral microscopy. (e) Relative ADORA1 levels in epithelial cancer cells quantified from eight independent lesions (see Table 1 for sample characteristics). Dotted line represents the threshold level for ADORA1 negativity, determined by ROC analysis with intensity values obtained from the luminal epithelial cells as control. Scale bars: 100 µm (a and d), 50 µm (a and d, inset).

