Figure S1.
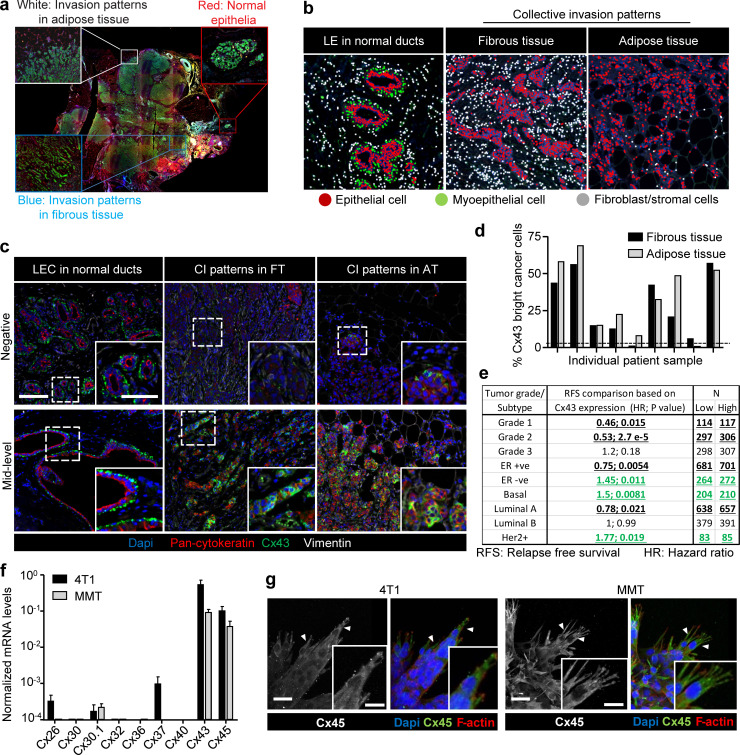
Expression of Cx43 in breast cancer cells during collective cancer cell invasion. (a) Original colored fluorescence overview of breast cancer lesions with zoomed insets on normal ducts and tumor invasive margins. (b) Trainable cell phenotyping function of the Inform software to identify different cell types within a multicellular tissue based on spectral fluorescence fingerprinting. Images display the results of the per-cell phenotyping analysis in normal ducts (luminal epithelial cells [LE]) and collective invasion (CI) patterns in fibrous and in adipose tissue. In each region, different cell types are marked by colored dots, as indicated. For all regions devoid of bilayered ducts, cells of epithelial origin, based on pan-cytokeratin, were considered as invasive breast cancer cells. (c) Unmixed composite images of Cx43 intensity in epithelial cancer cells within the tumor margins of representative samples with negative (upper panel) and mid-level (lower panel) Cx43 expression. (d) Heterogeneous expression of Cx43 within cancer cells of the collective invasion patterns in different tumor regions and samples. Values represent the percentage of Cx43 positive cancer cells. (e) Summary of Kaplan–Meier survival analysis correlating RFS with Cx43 expression in breast cancer patients categorized based on grade or molecular subtype. Bold and underlined values indicate positive (black) or inverse (green) association with Cx43 expression. P values, log-rank test. (f) Quantitative PCR for nine connexin subtypes relevant for the mammary gland (Cx26, Cx30, Cx30.1, Cx32, Cx36, Cx37, Cx40, Cx43, and Cx45). Connexin mRNA expression in 4T1 (black) and MMT (gray) cells from 3D collagen invasion cultures. Values represent mean normalized mRNA levels and SEM from three independent experiments. (g) Cx45 localization in collectively invading strands in 3D collagen. Confocal images represent maximum intensity projections from 3D confocal stacks. Arrowheads, cytoplasmic protrusions. Scale bars: 100 µm (c), 50 µm (c, inset), 20 µm (g).

