Figure S2.
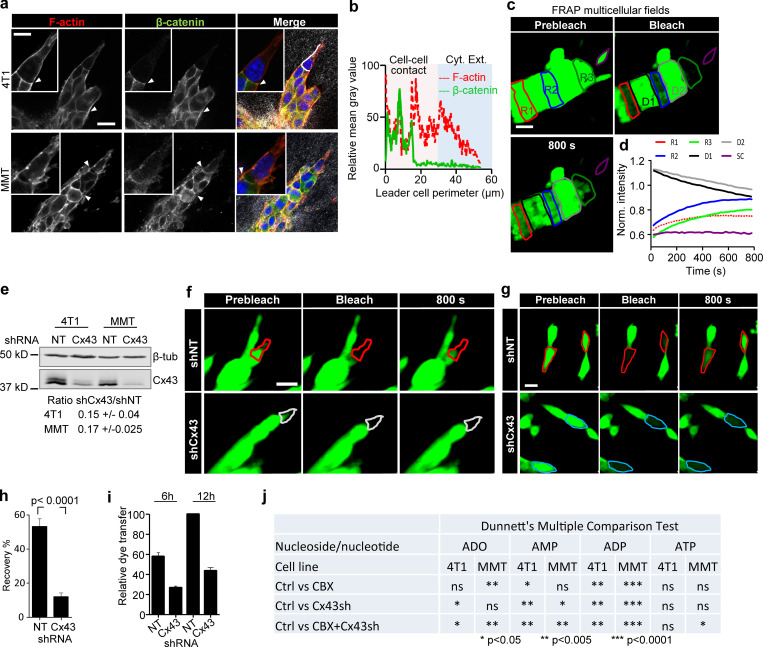
Collectively invading cancer cells maintain Cx43-mediated GJIC and extracellular nucleotide release. (a) β-Catenin localization along cell–cell junctions between both leader cells and follower cells in collective strands of 4T1 and MMT cells invading 3D fibrillar collagen. Arrowheads, cell–cell junctions. (b) Intensity distribution of β-catenin and F-actin along the circumference of a leader cell (white dashed border). Values show the pixel intensity with background subtraction. (c) Multicellular 3D gap FRAP. Single confocal slices of calcein-labeled invasive 4T1 strands before and after photobleaching. Contours indicate regions of interest for bleaching, including follower regions (red: R1; blue: R2), an invasive front (green: R3), and a single detached cell (SC; purple), in addition to the unbleached neighboring regions D1 and D2. (d) Normalized mean calcein fluorescence intensity of the selected regions. (e) Western blot for Cx43 and β-tubulin as loading control. Whole-cell lysates extracted from 4T1 and MMT cells with stable expression of shNT or shCx43; ±SD. (f and g) Fluorescence recovery of calcein-labeled MMT leader cells expressing shNT or shCx43 during invasion in 3D collagen (f) and physically connected cells in 2D culture (g). (h) Values represent the means and SEM of at least 19 bleached cells from 2D culture per condition from three independent experiments. P values, two-tailed unpaired Mann–Whitney test. (i) Relative dye transfer in parachute assay of 4T1 with nontargeting shRNA (NT) and Cx43 shRNA (Cx43) after 6 or 12 h of cell–cell (donor–receiver) encounter. Values represent the means and SEM from two independent experiments. (j) Summary of the effect of Cx43 down-regulation and/or CBX treatment on the reduction of individual nucleotide and nucleosides concentration detected in the media of 4T1 and MMT collagen cultures by HPLC (related to Fig. 2 k). Concentrations from CBX-treated and Cx43 shRNA cultures were compared with control cells (Ctrl, untreated cells with nontargeting shRNA). P values, ANOVA with Dunnett’s multiple comparison test (ns, not significant). Scale bars: 20 µm (a, c, f, and g), 10 µm (a, inset).

