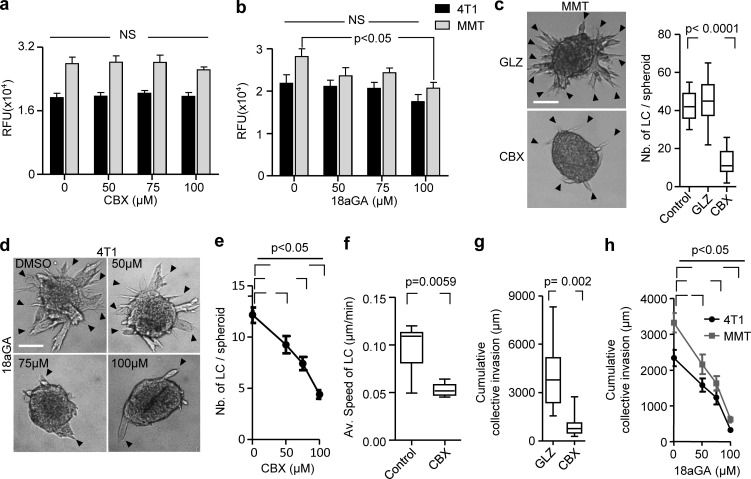
Figure S3.
Cx43 dependence of leader cell function. (a and b) Resazurin cytotoxicity assay for 4T1 and MMT cells in 3D collagen for 24 h in the presence of vehicle control and escalating doses of CBX (a) and 18aGA (b). Values represent the mean relative fluorescence unit (RFU) with SEM of two or three independent experiments. P values, one-way ANOVA with Bonferroni multiple comparison test. (c) Bright-field images after 24 h of MMT cell invasion in 3D collagen in the presence of CBX or an inactive structurally homologous control compound (GLZ). Data represent the medians (black line), 25th/75th percentiles (box) and maximum/minimum (whiskers) of 8–11 MMT spheroids per condition pooled from three independent experiments. P value, two-tailed unpaired Mann–Whitney test. (d) Efficacy of collective invasion in 4T1 spheroids in the presence of escalating doses of 18aGA. Bright-field images after 24 h of culture. Arrowheads (c and d), tips of invasion strands.(e) 4T1 leader cell (LC) initiation in the presence of escalating doses of CBX. Data represent mean values and SEM from 23 to 40 spheroids per condition pooled from at least three independent experiments. P value, ANOVA with Bonferroni multiple comparison test. (f) Speed of MMT leader cells during collective invasion in 3D collagen. Values represent median (black line), 25th/75th percentiles (box) and maximum/minimum (whiskers) of seven or eight leader cells from one experiment. P value, two-tailed unpaired Mann–Whitney test. (g) Cumulative collective invasion of MMT cells. Data represent the medians (black line), 25th/75th percentiles (box) and maximum/minimum (whiskers) of 8–11 MMT spheroids per condition pooled from three independent experiments. P value, two-tailed unpaired Mann–Whitney test. (h) Cumulative collective invasion of 4T1 and MMT spheroids in the presence of escalating doses of 18aGA. Data represent mean values and SEM from 12 spheroids per condition pooled from three independent experiments. P value, ANOVA with Bonferroni multiple comparison test. Scale bars: 100 µm (c and d).

