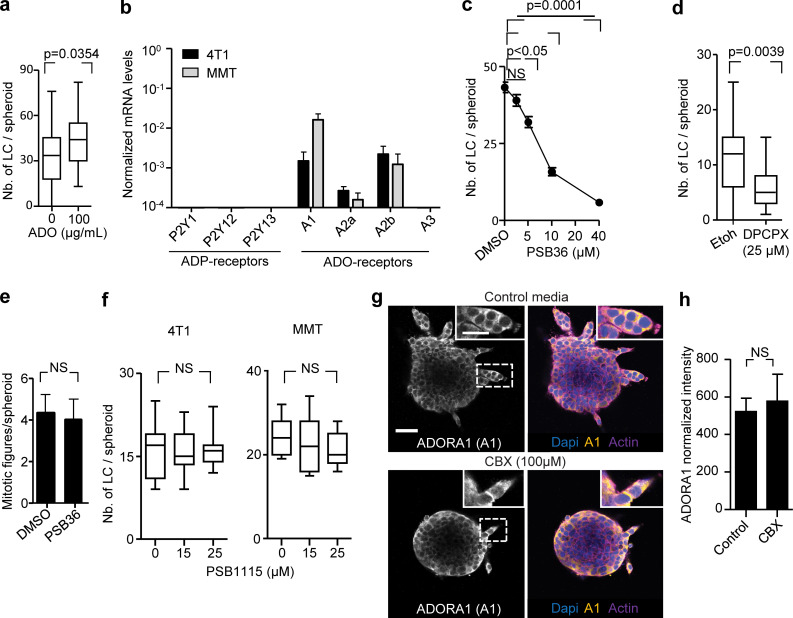
Figure S4.
Cx43-mediated nucleotide release in LC initiation. (a) Leader cell (LC) initiation in MMT spheroids expressing shCx43 after 24 h of invasion in collagen in the presence and absence of exogenous ADO. Values display median (black line), 25th/75th percentiles (boxes) and maximum/minimum values (whiskers) of 30–35 spheroids per condition pooled from three independent experiments. P value, two-tailed unpaired Mann–Whitney test. (b) Purinergic receptor mRNA expression in 4T1 (black) and MMT (gray) cells during collective invasion in 3D collagen assessed by quantitative PCR. Values represent the mean normalized mRNA levels and SEM from three independent experiments. (c) MMT leader cell initiation in the presence of vehicle and escalating doses of PSB36. Values represent mean values and SEM of at least 20 spheroids per condition pooled from three independent experiments. P values, Kruskal–Wallis test with Dunn’s multiple comparison test. (d) Leader cell initiation in response to DCPX treatment 12–15 h of invasion of 4T1cells in collagen. Values display medians (black lines) 25th/75th percentiles (boxes) and maximum/minimum values (whiskers), 23–27 spheroids from three independent experiments. P values, two-tailed unpaired Mann–Whitney test. (e) Mitotic figures in 4T1 spheroid after 24 h of invasion in collagen. Values represent average number and SEM of mitotic figures per spheroids, three spheroids (≥1,000 cell/spheroid) per condition. P value, two-tailed unpaired Mann–Whitney test. (f) Leader cell initiation of 4T1 and MMT spheroids after 12–15 h of invasion in collagen in the presence of ADORA2b inhibitor PSB1115. Values display medians (black lines) 25th/75th percentiles (boxes) and maximum/minimum values (whiskers), 4–12 spheroids from one experiment. P values, Kruskal–Wallis test with Dunn’s multiple comparison test. (g) Expression and distribution of ADORA1 in 4T1 spheroids treated with vehicle control or CBX for 24 h. Images represent single confocal slices. (h) ADORA1 expression of the outer cellular layer. Data represent the background-corrected mean fluorescence and SD of four (control) or six (CBX) spheroids from one experiment. P value, two-tailed unpaired Mann–Whitney test. Scale bars: 50 µm (g), 25 µm (g, inset).

