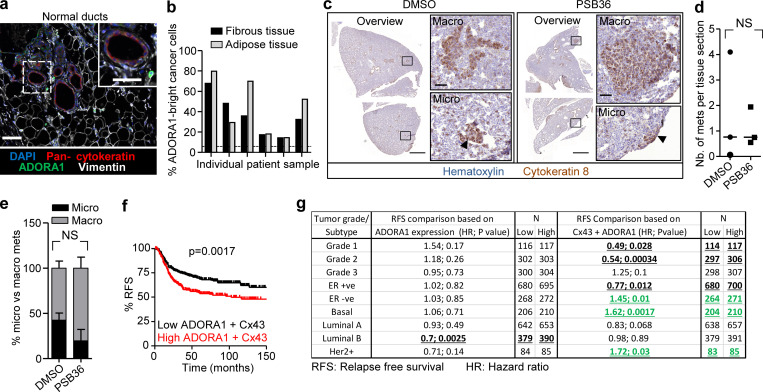
Figure S6.
Role of ADORA1 in preclinical spontaneous metastasis and prognostic relevance in clinical samples. (a) Detection of ADORA1 in normal ducts within clinical samples using multispectral microscopy. (b) Frequency of ADORA1-positive cancer cells with collective invasion patterns in breast lesions. Data represent the fibrous and adipose tissue from individual patients. (c) Overviews of lung sections isolated from DMSO and PSB36 (30 mg/kg) treated mice, stained for cytokeratin-8. Insets and arrowheads depict macro- and micrometastases. (d) Average number of micro- and macrometastases normalized per lung section. Data represent a total of 135–145 lung sections from three independent mice per group. (e) Relative frequency of micro- or macrometastases per treatment group: DMSO: 39 micrometastases, 59 macrometastases, 98 total; PSB36: 39 micrometastases, 91 macrometastases, 130 in total. Data show the mean percentages and SD from three mice. P value, two-tailed unpaired Mann–Whitney test. (f and g) Kaplan–Meier survival analysis predicting RFS in (f) basal-type breast cancer patients. (g) Correlation of ADORA1 or combined ADORA1 and Cx43 expression in clinical samples. Classification was based on tumor grade and molecular subtype (Györffy et al., 2010). Bold and underlined values show the positive (black) or inverse (green) association with ADORA1/Cx43 expression. (f and g) P values, log-rank test. Scale bars: 100 µm (a), 50 µm (a and c, inset), 1,000 µm (c, overview).

