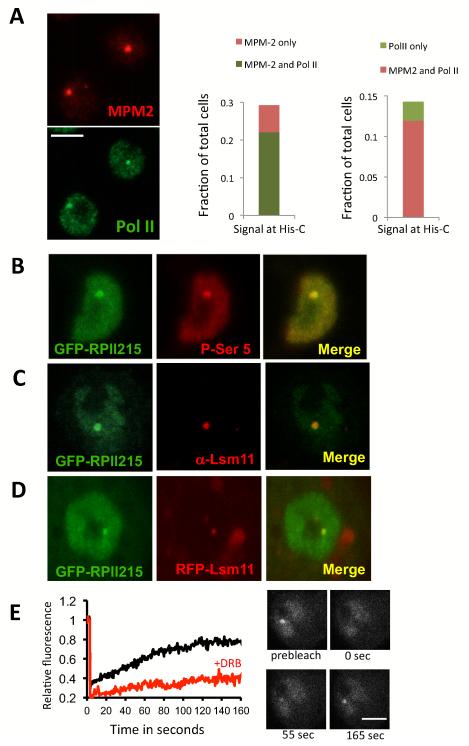
Figure 1.
Visualizing RNA polymerase II transcription at the histone gene locus. (A) Left panel, Co-staining of S2 cells with MPM2 antibody (red) and Pol II P-Ser5 antibody in green. Middle panel, fraction of cells showing MPM-2 staining (light Red) and MPM-2/Pol II co-localization (light green). Right panel, fraction of cells showing Pol II His-C staining (light green) and MPM-2/Pol II co-localization (light red) (N=336). Bar = 5μm. (B) A stable cell line expressing GFP-RPII215 (Pol II-green) stained with P-Ser5 antibody (red); and showing co-localization. (C) A stable cell line expressing GFP-RPII215 is stained with Lsm11 (red) antibody, showing co-localization. (D) A stable cell line expressing both GFP-RPII215 (green) and RFP-Lsm11 (red); and showing co-localization. (E) FRAP experiment tracking GFP-RPII215 at the histone locus. Left panel: Black line shows recovery of signal from untreated cells. The red line shows recovery of signal from cells treated with DRB. Average of 10-15 FRAP experiments, standard error <15%. Right panel: Example of of GFP-RPII215 FRAP at the histone locus. Bar = 5μm.

