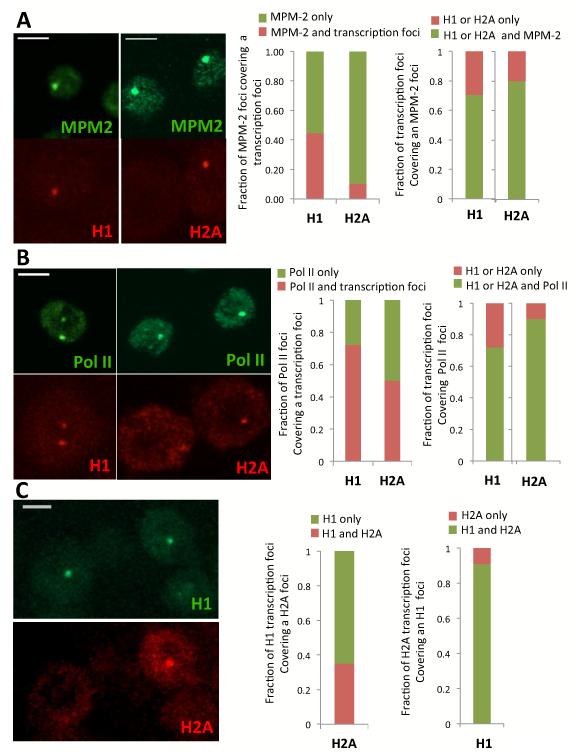
Figure 2.
Visualizing nascent transcription of the histone genes by FISH in single S2 cells. (A) Co-staining of MPM2 antibody (green) with H1 or H2A mRNA FISH (red), bar=5μm. Middle panel shows fraction of MPM-2 signal co-localized with H1 or H2A. Right panel shows fraction of H1 and H2A foci colocalized with MPM-2 staining (N=60-116) (B) Co-staining of Pol II P-Ser5 (green) with H1 or H2A mRNA FISH (red), bar=5μm. Middle panel shows fraction of Pol II His-C signal co-localized with H1 or H2A. Right panel shows fraction of H1 and H2A foci colocalized with Pol II His-C staining (N=40-93) (C) Co-staining through FISH of H1 (green) and H2A (red). Middle panel shows fraction of co-localized signals of H1 with H2A, bar=5μm. Right panel shows fraction of co-localized signals of H2A with H1.

