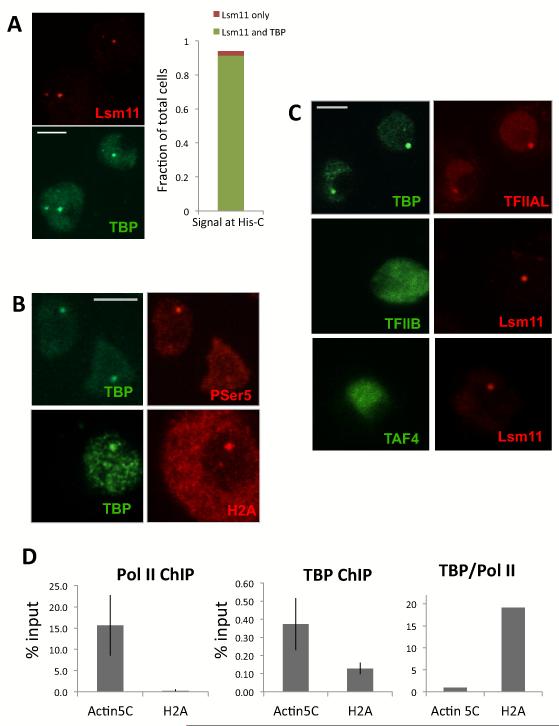
Figure 4.
TBP and TFIIA accumulation at the histone locus in interphase. (A) Left panel, co-staining of Lsm11 antibody (red) with TBP antibody (green). Right panel, distribution of Lsm11 and TBP signal at His-C among the total number of cells, using Lsm11 signal as reference. (B) Co-staining of TBP (right) with Pol II P-Ser5 or with H2A mRNA FISH (left). (C) Upper panel, co-staining of TBP (green) with TFIIAL (red). middle panel, co-staining of TFIIB (green) with Lsm11 (red). Lower panel, co-staining of TAF4 (green) with Lsm11 (red). (D) Left and middle panel, chromatin immunoprecipitation of Pol II and TBP on Actin5C and H2A promoter, error bar is Standard Deviation of three independent ChIP. Right panel, ratio of TBP ChIP to Pol II ChIP on Actin5c and H2A promoter, normalized to 1 for Actin5C.

