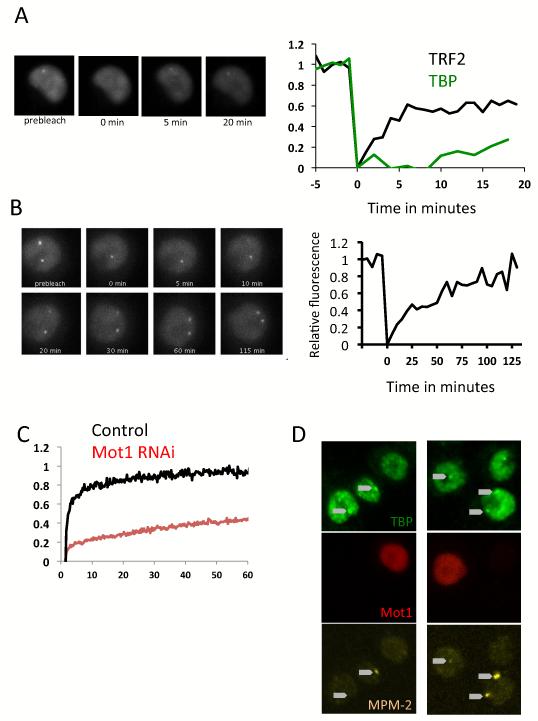
Figure 7.
FRAP analysis of TBP and TRF2 binding kinetics in the nucleoplasm and at the histone gene locus. (A) FRAP recovery over 20 minutes of GFP-TRF2 (left and right panel) or GFP-TBP at the histone locus, average of 10 cells. (B) Representative FRAP recovery of GFP-TBP at the histone locus. GFP-TBP at His-C fully recovers in 120 minutes. (C) FRAP recovery of GFP-TBP in random locations of the nucleoplasm +/− RNAi of Mot1. Average of 20 FRAP, standard errors are <10%. GFP-TBP in the nucleoplasm fully recovers in one minute. (D) Overexpression of Drosophila Mot1 in S2 cells. Mot1 appears in red TBP is stained in green, and MPM-2 in Yellow. Arrow point to the TBP foci location. Images are maximum projections of Z-stacks.

