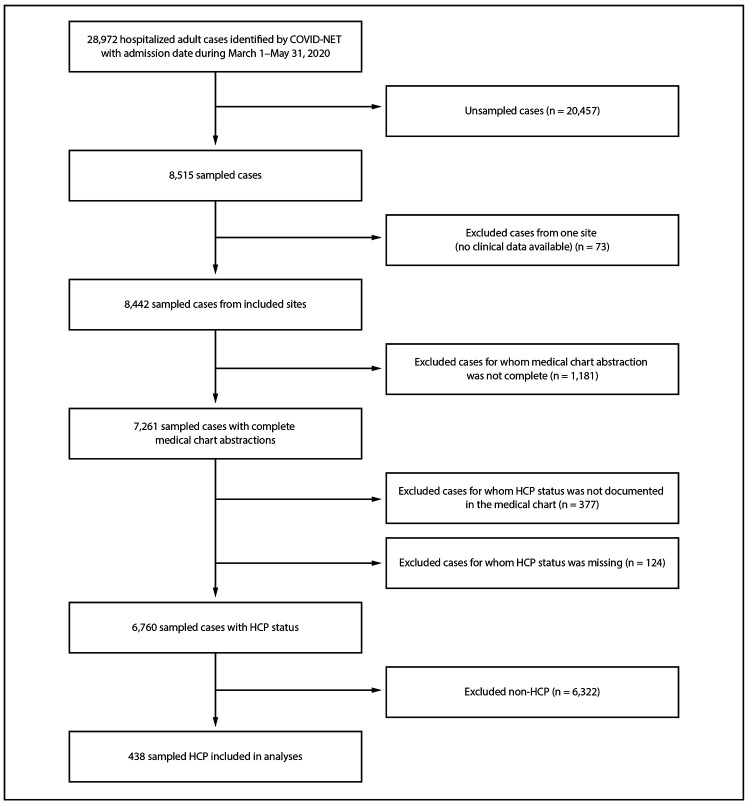
FIGURE 1.
Selection of cases for analysis of COVID-19–associated hospitalizations among health care personnel (HCP)* — COVID-NET, 13 states,† March 1–May 31, 2020
Abbreviations: COVID-19 = coronavirus disease 2019; COVID–NET = COVID–19–Associated Hospitalization Surveillance Network.
* All case counts are unweighted.
† Sites located in the following 13 states: California, Colorado, Connecticut, Georgia, Maryland, Michigan, Minnesota, New Mexico, New York, Ohio, Oregon, Tennessee, and Utah.

