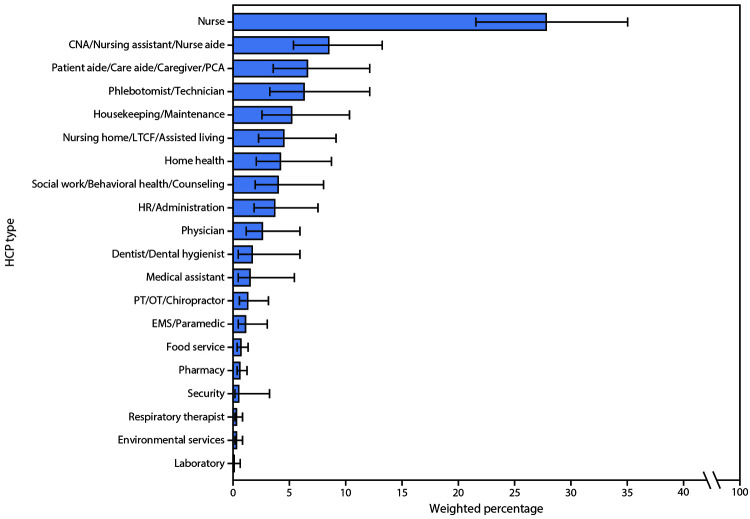
FIGURE 2.
Weighted percentage of personnel types*,† among reported health care personnel (HCP) with COVID-19–associated hospitalizations (N = 438) — COVID–NET, 13 states,§ March 1–May 31, 2020
Abbreviations: CNA = certified nursing assistant; COVID-19 = coronavirus disease 2019; COVID–NET = COVID–19–Associated Hospitalization Surveillance Network; EMS = emergency medical services; HR = human resources; LTCF = long-term care facility; OT = occupational therapist; PCA = patient care assistant; PT = physical therapist.
* HCP categorized as “unspecified” or “other” have not been included in the figure but are included in the denominator.
† Error bars represent 95% confidence intervals.
§ Sites located in the following 13 states: California, Colorado, Connecticut, Georgia, Maryland, Michigan, Minnesota, New Mexico, New York, Ohio, Oregon, Tennessee, and Utah.

