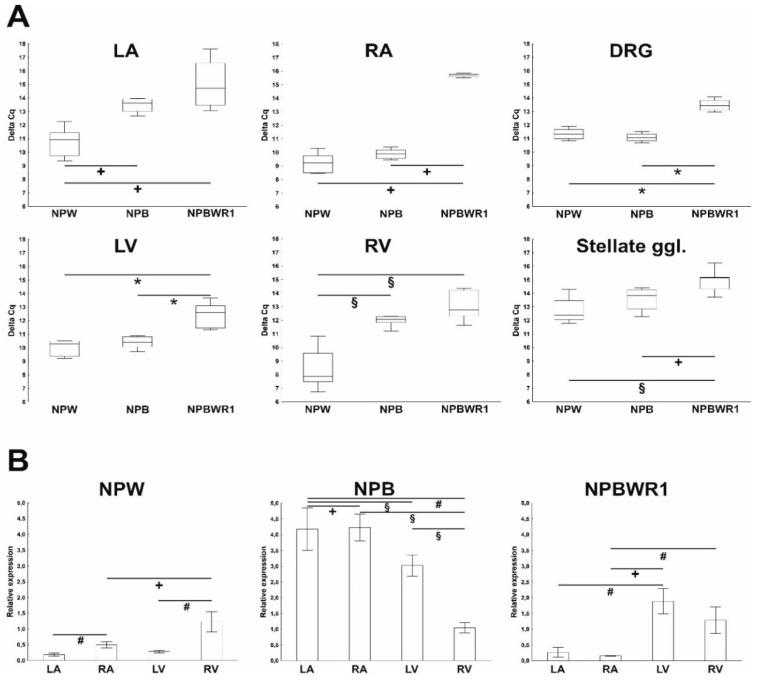
Figure 1.
Quantitative RT-PCR analyses of neuropeptide B (NPB), neuropeptide W (NPW), and NPBWR1 mRNAs in heart chambers of rats. (A) Comparison of expression of studied genes within each heart compartment, dorsal root ganglia (DRG) and stellate ganglia. Data are presented as ΔCq values (compared to β-actin) to indicate differences in expression between different targets. Hence, low values represent high expression. Statistically significant differences are shown graphically (Mann–Whitney test; n = 5–8 in each group). (B) Comparison of separate heart compartments: left atrium (LA), right atrium (RA), left ventricle (LV) and right ventricle (RV). Data are presented as relative expression ± SEM. Mean values from RV were used as a calibrator and were settled as 1. Statistically significant differences between the heart compartments are shown graphically (Mann–Whitney test; n = 5–8 in each group). # p < 0.05, + p < 0.01, § p < 0.005, * p < 0.001.

