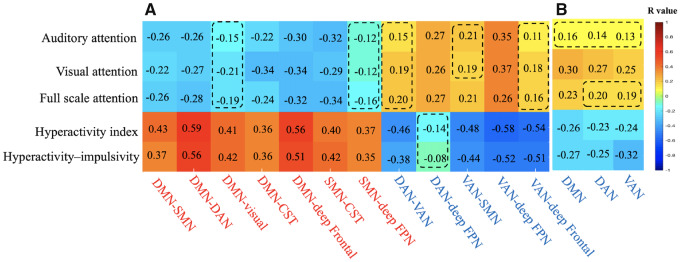
Figure 4.
Correlation between (A) functional connectivity, (B) within-network activity and scores of hyperactivity behaviour and attention. The rows indicate functional connectivity/within-network activity, with red indicating higher activity in ADHD and blue indicating lower activity in ADHD, while the columns indicate clinical measures in terms of hyperactivity behaviour and attention performance. The number in each cell is the correlation coefficient (r) with red cells indicating a positive correlation and blue cells indicating a negative correlation. The dashed box indicates a nonsignificant correlation (P > 0.05).

