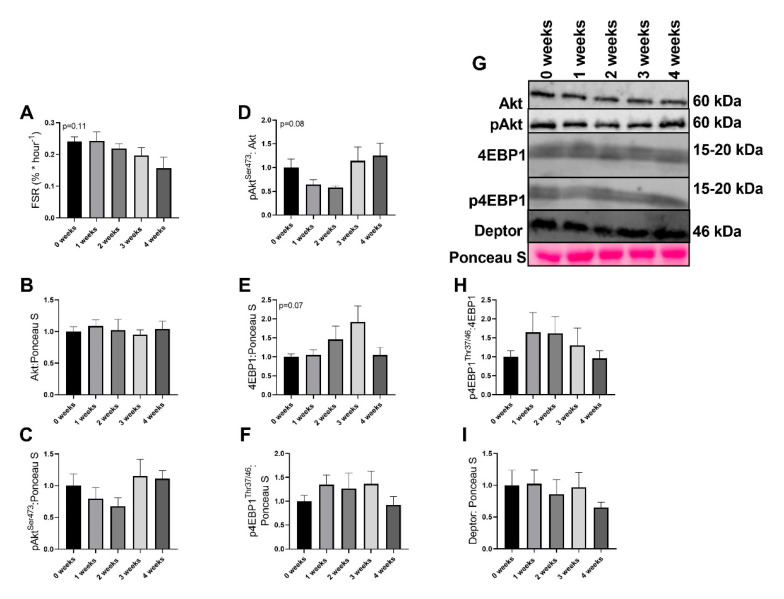
Figure 3.
Markers of protein anabolism in the diaphragm. (A) Fractional synthesis rate (FSR) (B) Akt protein content (C) pAktSer473 protein content. (D) pAktSer473/Akt protein content. (E) 4EBP1 protein content (F) p4EBP1Thr37/46 protein content. (G) Representative images for immunoblot data (H) p4EBP1Thr37/46/4EBP1 protein content. (I) Deptor protein content. Data are presented as mean ± SEM. n = 8–10/group.

