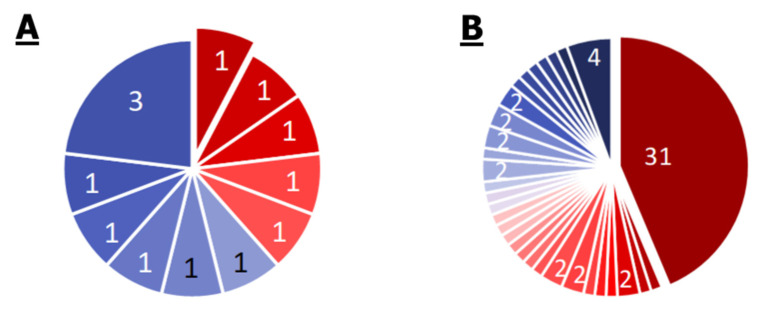
Figure 5.
Pie chart of the proportion of annotations in the 92 genomes of Mycoplasma spp. strains. Numbers depict annotations with equal frequency. Frequency—from 0.01 to 1—is presented in the color of slices on the scale from blue to red for distribution of modules (A) and pathways (B). Small slices without numbers correspond to the sole annotation with such frequency. All the modules in the pangenome are metabolic and no modules of resistance are found. Distribution of pathway frequencies is remarkably dispersed. Only 42% of pathways are present in all genomes.

