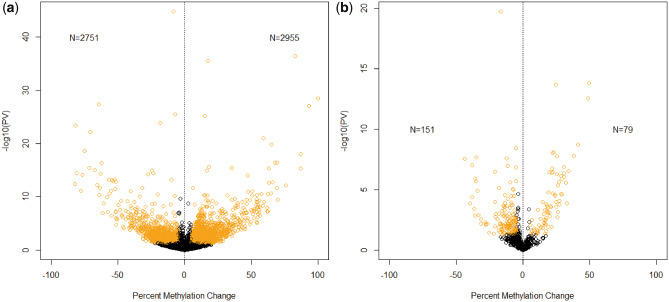
Figure 1:
Volcano plot of significantly DMSs between F1 generation (A) and F2 generation (B) descendants of TCDD-treated and -untreated zebrafish testes depicting percent methylation change and P-value of methylated sites (circles). Significantly changed CpG sites (percent methylation change 5%; P-value ≤0.05) are in yellow

