Figure 2.
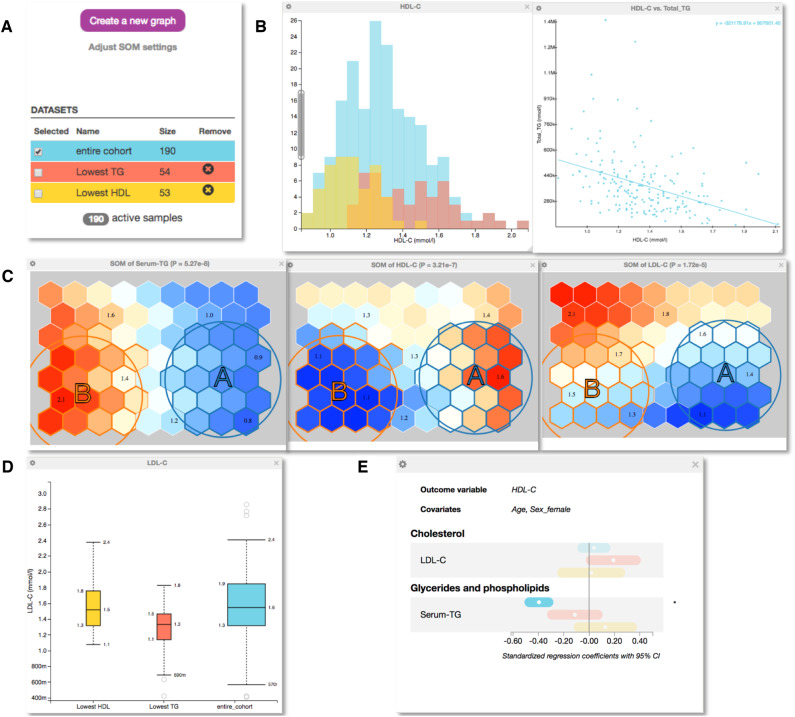
Explorative analysis of a cohort of 190 samples with serum NMR metabolomics and mass spectrometry lipidomics measures available. A: The control panel of EpiMetal that contains clickable buttons for generating graphs and selecting, naming and generating subgroups. Colours indicate the entire cohort (cyan) and selected subgroups based on the self-organizing map (SOM) analysis. B: The histograms of HDL-C in the entire cohort and in the subgroups and the scatterplot of HDL-C vs triglycerides. C: The SOM component planes for serum triglycerides, HDL-C and LDL-C (note that the individuals in the entire cohort are identically distributed in each plane). Colours indicate high (red) and low (blue) concentration values of the variable in each plane. Individuals with similar metabolic profiles cluster close to each other in the SOM component planes. The user can specify and select different subgroups via the circular selection tools. D: A box plot for LDL-C in the entire cohort and in the two subgroups. E: Regression analyses with a forest plot showing standardized regression coefficients. Standardization means, that prior to analyses, all continuous, non-binary variables are normalized to zero mean and unit standard deviation. Point estimates are indicated by a dot surrounded by 95% confidence interval (CI). Plotting HDL-C as the outcome and triglycerides as an exposure illustrates the same negative association as already indicated via the scatterplot in B.

