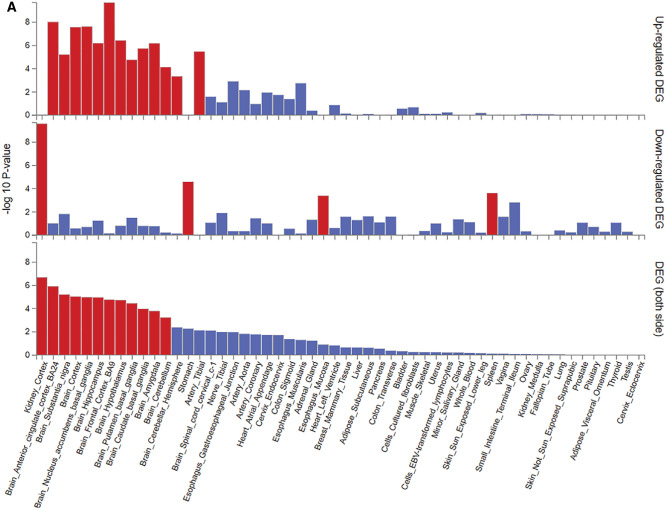
Figure 2.

Based on the analyses using GTEx v8 54 tissue-types data, we identified 17 tissues in which body mass index (BMI)-associated genes were differentially expressed, indicated by black/red bars. (A) Was directly taken from the online tool Functional Mapping and Annotation (FUMA).17 (B) Clustering of the BMI-associated genes in the tissue-grouped gene sets. Differentially expressed genes in a given tissue are shown in black/red; grey/blue indicates no differential expression in a given tissue.

