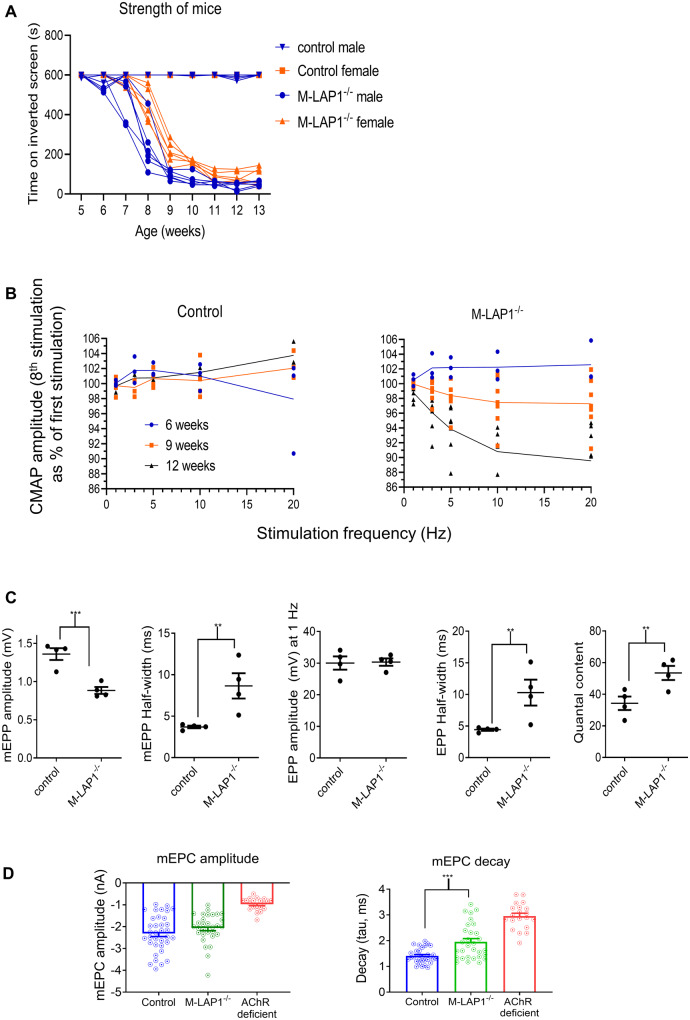
Figure 4.
Analysis of strength and electrophysiology of M-LAP1−/− mice. (A) Strength test of M-LAP1−/− mice and littermate controls using an inverted screen hang test. The time the mice hung onto the mesh was measured, and the endpoint was 10 min. Six mice for each group were measured, error bars show standard deviation. (B) EMG data from gastrocnemius of M-LAP1−/− and littermate control mice. Summary of EMG data showing how decrement (represented as the value of the 8th stimulus as a percentage of the first) varies with stimulation frequency for mice aged 6, 9, and 12 weeks (n = 3 mice control 6 and 12 weeks and M-LAP1−/− 6 weeks; 4 mice control 9 weeks; 7 mice M-LAP1−/− 9 and 12 weeks). (C) Single electrode analysis of muscle membrane potential in diaphragm/phrenic nerve preparations from 12-week-old mice. Summary of the data showing mEPP and EPP amplitudes, mEPP and EPP half widths and quantal content. (n = four mice per group; *P < 0.05, **P < 0.01, ***P < 0.001). (D) Measurements of endplate current using two-electrode voltage clamp potential in diaphragm/phrenic nerve preparations from 12-week-old mice. Summary of decay (tau) and mEPC amplitude. Also included is data from an AChR deficiency mouse model in which only foetal AChRs are expressed, for comparison. (n = three mice per group; ***P < 0.001).

