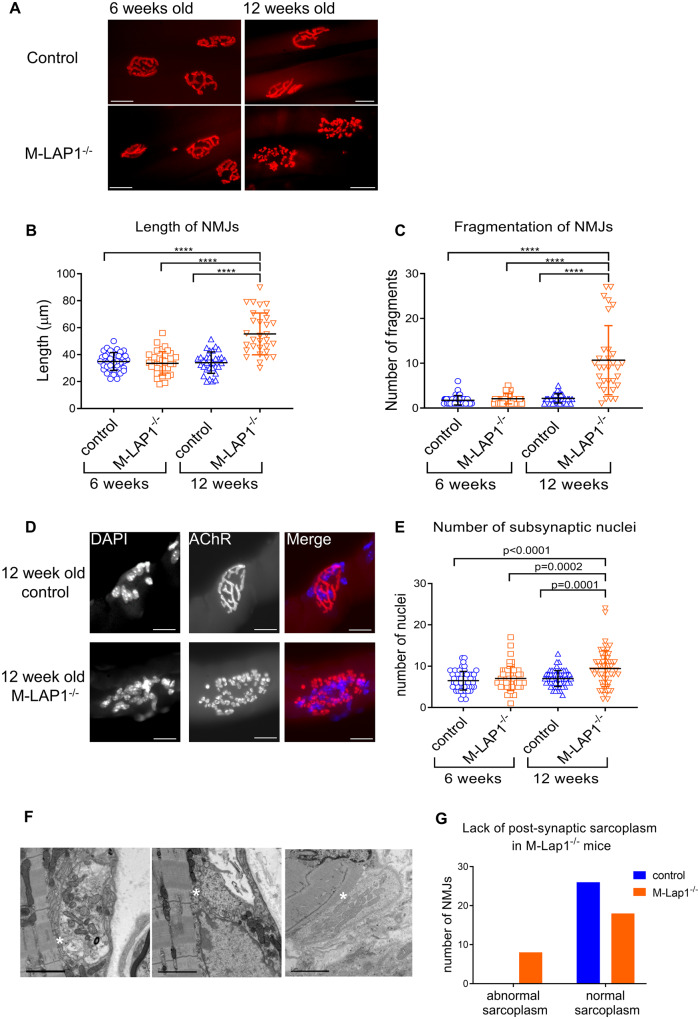
Figure 6.
Morphology of NMJs in EDL muscles from M-LAP1−/− mice and littermate controls at 6 and 12 weeks of age. (A–C) Morphological analysis of NMJs at 6 and 12 weeks of age in EDL muscles from M-LAP1−/− mice and littermate controls. (A) The NMJs were visualised by staining AChRs with 594-α-BuTx (red), scale bar=20µm. (B, C) Length of NMJs and the number of fragments which made up each NMJ were measured. Each point represents a NMJ. Two mice per group, number of NMJs per mouse: 6 week control 20,20; 6 week M-LAP1−/− 21,16; 12 week control 20,11; 12 week M-LAP1−/− 14,17. ANOVA analysis with Tukey’s multiple comparison, ****P < 0.0001. (D, E) Synaptic nuclei number in M-LAP1−/− and control mice EDL muscle. D Examples of NMJs from 12 week old control and M-LAP1−/− mice showing the nuclei (left panels, stained with DAPI) and AChRs (middle panels, stained with 594-α-BuTx). Right panels show merged images. In this example, the control NMJ has eight subsynaptic nuclei and the M-LAP1−/− NMJ has 23. Scale bar=20 µm. (E) Quantification of number of subsynaptic nuclei in 6 week old and 12 week old control and M-LAP1−/− mice. Each point represents a NMJ. Three mice per group, number of NMJs per mouse: 6 week control 20,18,17; 6 week M-LAP1−/− 19,19,16; 12 week control 23,18,19; 12 week M-LAP1−/− 20,17,20. ANOVA analysis with Tukey’s multiple comparison, P values as shown. (F, G) Transmission electron microscopy analysis of NMJs in EDL muscle from 12 week-old M-LAP1−/− mice and littermate controls. (F) Example electron micrographs showing abnormal endplates in which there is a reduction in the sole plate, meaning that there is very little post-synaptic sarcoplasm and the nerve terminal appears to almost touch the sarcomeres (indicated by white asterisks). Scale bars = 2 µm. (G) Contingency graph showing a reduction of sole plate area in some M-LAP1−/− mice but not in littermate controls. Number of NMJs analysed per group = 26, three mice per group. Chi-square (and Fisher’s exact test); P = 0.0042.

