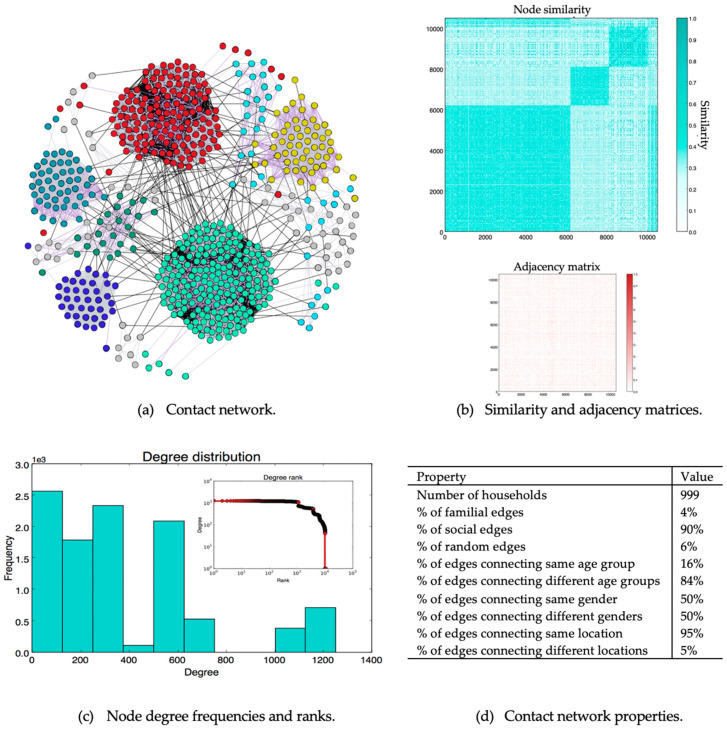
Figure 2.
Generated contact network information. (a) Part of the generated contact network showing contact relationships between 50 randomly selected households. The gray edges are familial, the purple edges are social, and the black edges are random. (b) Similarity and adjacency matrices. Each cell in the adjacency matrix indicates the existence (dark cell) or the absence (white cell) of an edge between each node pair. (c) Degree distribution. (d) General network properties.

