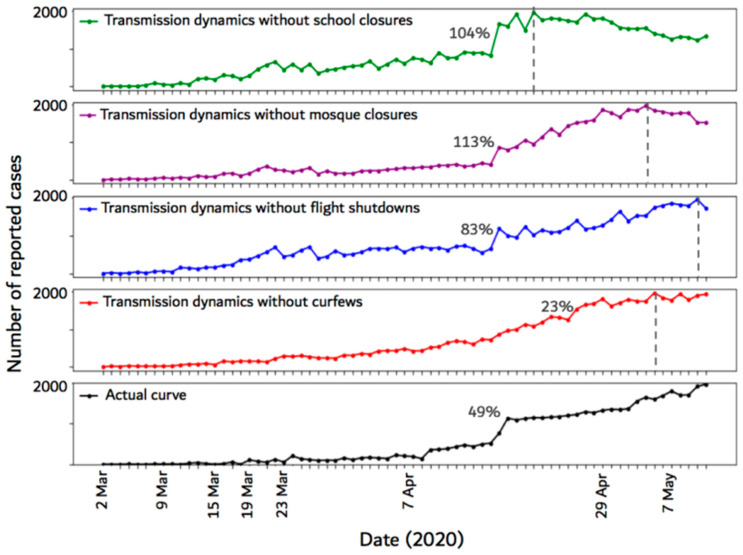
Figure 6.
Epidemic curves resulting from not implementing each of the four major control measures employed by the Saudi government. The dashed vertical lines show the time step (day) at which the number of new cases reached the maximum. Each percentage represents the maximum percentage increase in the number of infected cases between any two time-steps on the curve.

