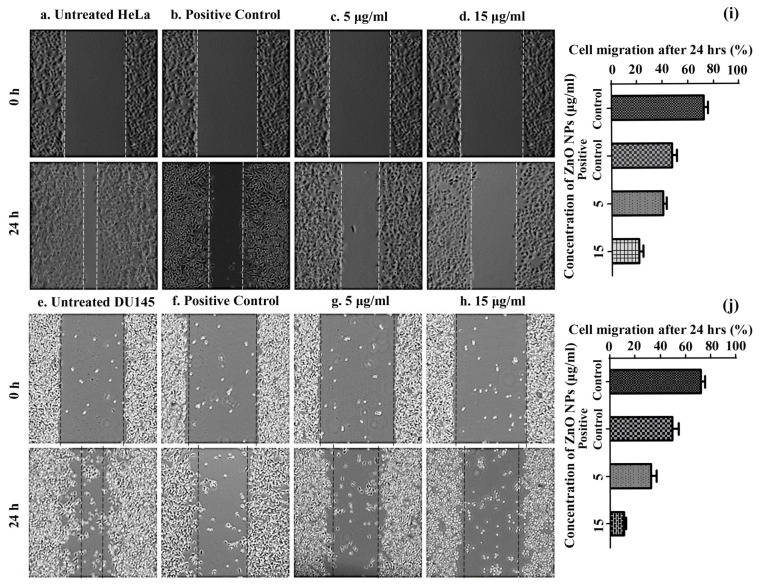
Figure 8.
Analysis of HeLa and DU145 cell migration by in vitro scratch assay observed at 4× magnification under fluorescent inverted microscope and quantified using ImageJ software. (a) Untreated HeLa control at 0 and 24 h, (e) Untreated DU145 control at 0 and 24 h, aqeous leaf extract treated negative control at 0 and 24 h in (b) HeLa (f) DU145 cell lines. Low concentration of ZnO NPs treatment (5 µg/mL) at 0 and 24 h in (c) HeLa and (g) DU145 cell lines. High concentration of ZnO NPs treatment (15 µg/mL) at 0 and 24 h in (d) HeLa and (h) DU145 cell lines. (i) Relative inhibition of cell migration due to all treatments and controls in both cell lines after 24 h.

