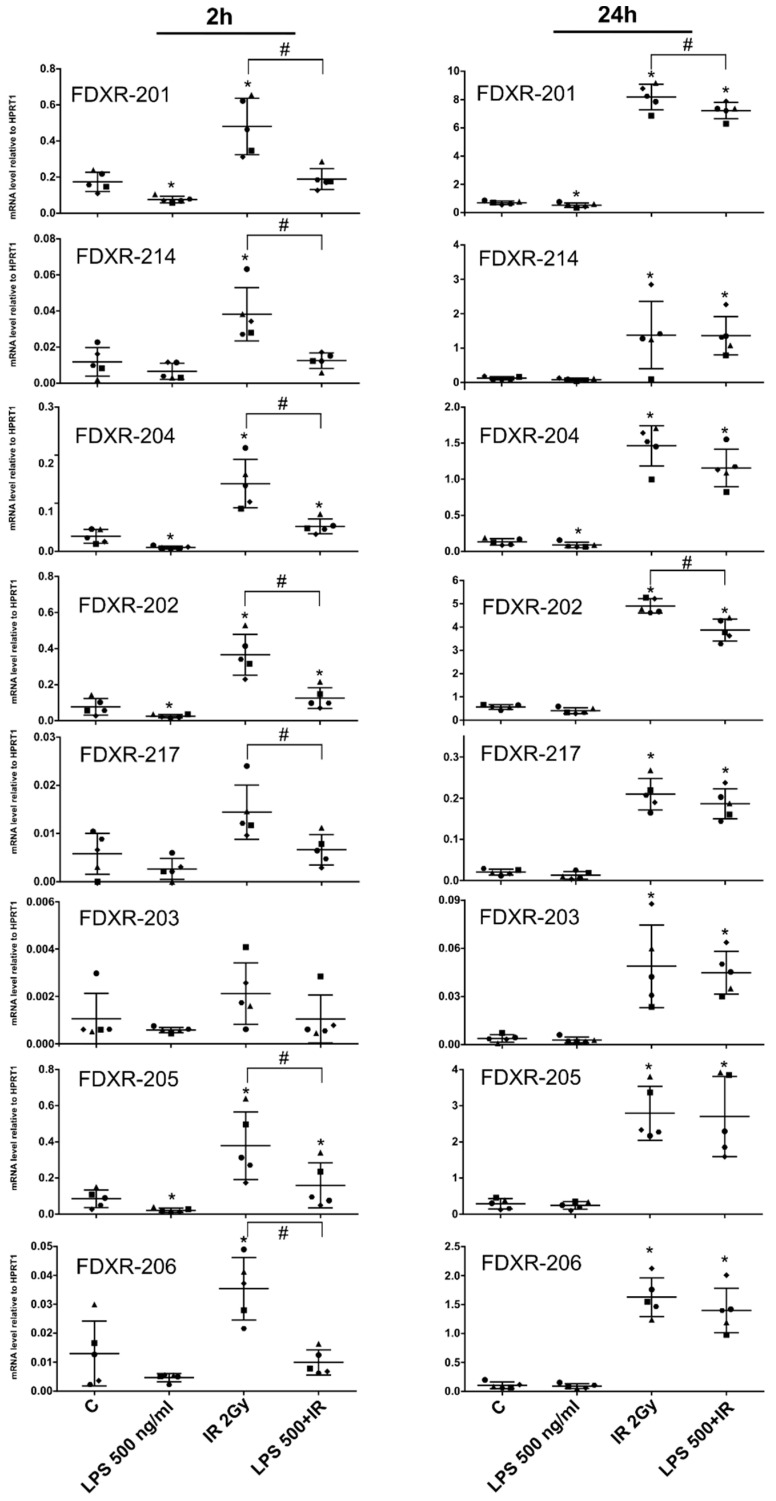
Figure 3.
Gene expression profile of FDXR variants in human blood irradiated and/or stimulated with LPS ex vivo. Blood from five male donors was incubated with LPS (500 ng/mL) 1 h before irradiation (2 Gy, 0.5 Gy/min). FDXR variants expression profile was analysed 2 h and 24 h post-irradiation. Data are shown as mean ± SD (n = 5). Statistical analyses were performed in log-transformed data. Significant differences (paired t-test, p ≤ 0.05) with the control were indicated with an asterisk (*) and differences with IR with a hash (#) (only for IR groups).

