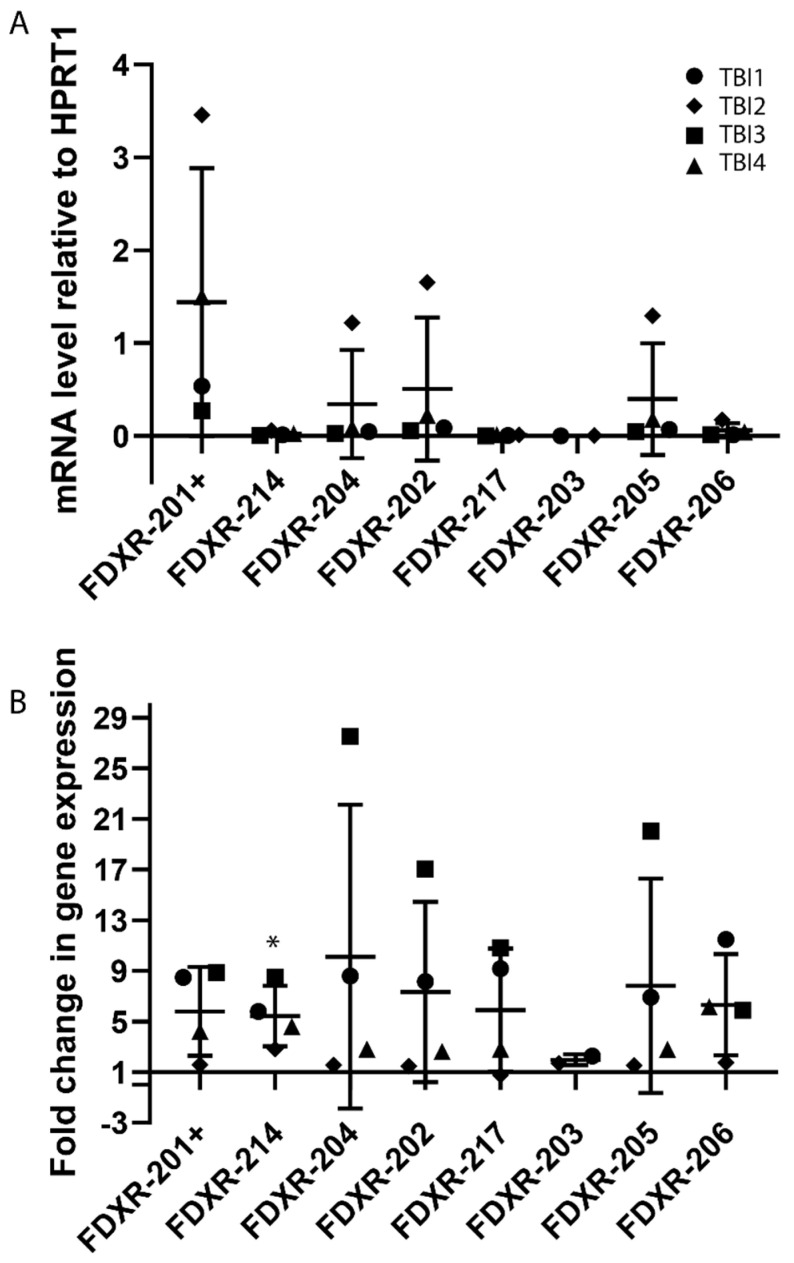
Figure 4.
Gene expression profile of FDXR variants in blood samples from total body irradiated patients. The variants basal level of expression was compared between the total body irradiated (TBI) patients (A). Total body irradiated patient’s samples (n = 4) were collected 24 h after the first fraction and 12 h after the second fraction with total received doses of 3.2 (TBI1), 3 (TBI2), 4 (TBI3), and 4 Gy (TBI4) respectively. The fold change is represented in the graph and values over 1 indicate an increase with respect to control values (B). Individual data points are shown for all patients, together with the mean ± SD (each patient is represented with a different symbol). One-way ANOVA followed by Tukey’s test was performed for statistical analysis. No significant differences were found between variants. Significant differences (paired t-test, p ≤ 0.05) with the control were indicated with an asterisk (*) in panel B.

