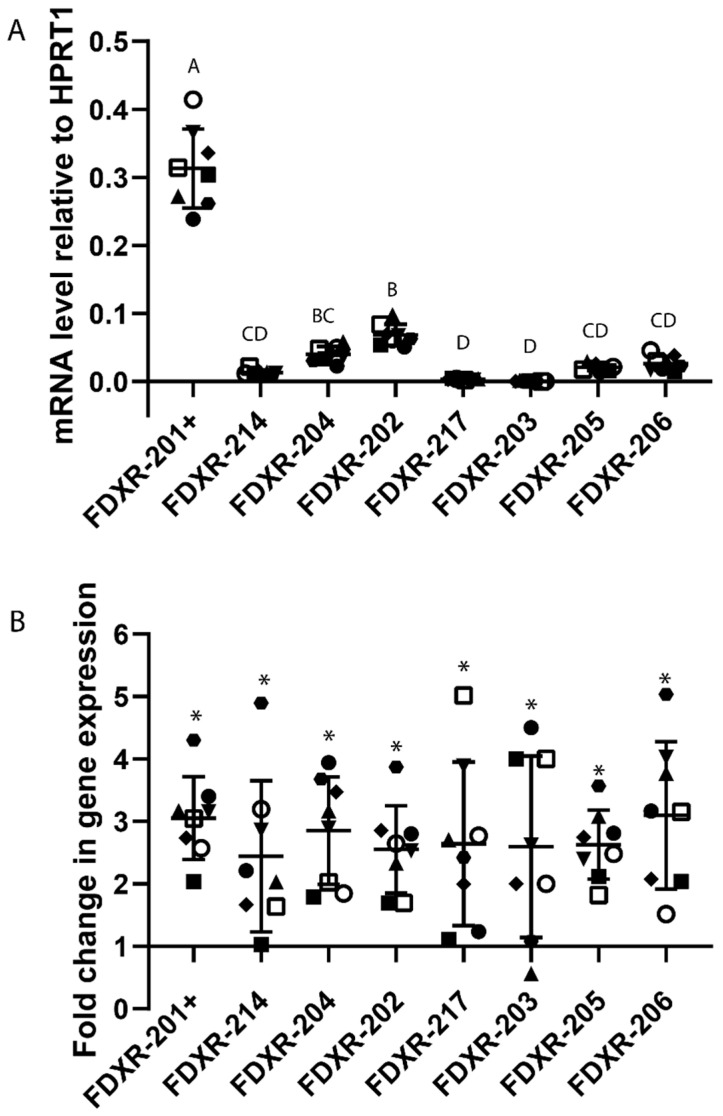
Figure 5.
Gene expression profile of FDXR variants in blood from Endometrial cancer patients treated with radiotherapy. The variants basal level of expression was compared between the patients (n = 8) (A). FDXR variants fold of change in expression 24 h after the first fraction (1.8 Gy) are represented in panel B. The fold change is represented in the graph and values over 1 or below 1 indicate an increase or decrease with respect to control values (B). Individual data points are shown for all patients, together with the mean ±SD (each patient is represented with a different symbol). One-way ANOVA followed by Tukey’s test was performed for statistical analysis. Values not sharing a common letter are significantly different. No significant differences were found between variants in panel B. Significant differences (paired t-test, p ≤ 0.05) with the control were indicated with an asterisk (*) in panel B.

