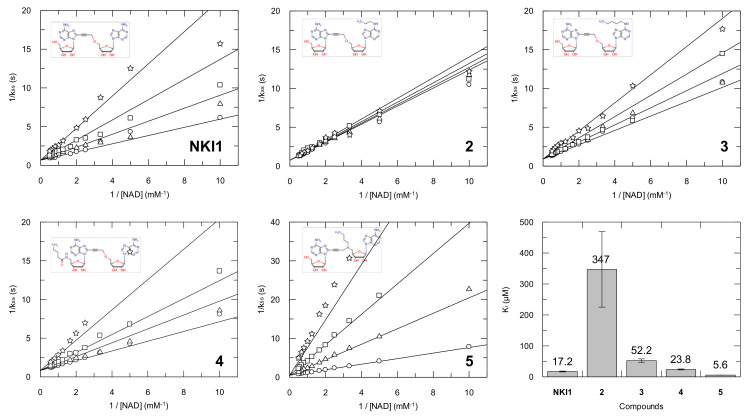
Figure 5.
Determination of inhibition constants of compounds 1–5. Inhibitor concentrations were 0 (circles), 10 (triangles), 25 (squares) and 50 (stars) µM. Secondary plots (kss as a function of initial NAD concentration) were fitted assuming a competitive inhibition using GraFit software (v 7.0.3) and are presented here as double reciprocal plots. Ki values determined are represented as bars (values are displayed on top of the bars).

