

Abstract
This study examines 14 years (2004–2017) of surface aerosol composition data from the EPA IMPROVE network with a focus on the monthly profile, sources, and chemical nature of extreme dust events (>92nd percentile of fine soil concentration each month) impacting ten sites along the United States East Coast ranging in latitude from Florida to Maine. Based on trajectory, remote sensing, and reanalysis data, dust events were categorized into four source categories: African, Asian, Mix (African + Asian), and Other (anything other than African and Asian). The results reveal that extreme dust events account for between 3.3% and 4.6% of total available days depending on the site. March-April-May (MAM) had the most (174) dust events, followed by June-July-August (JJA) with 172, and then by September-October-November (SON) with 160 and December-January-February (DFJ) with 150. There is a variability in the predominant dust sources based on latitude, with African and Other sources more influential from North Carolina to the south, while Asian and Other were most important from New Jersey to the north. The Mix category is consistently the least frequent dust category at all sites. The African dust category was linked to the highest fine soil levels across the entire East Coast relative to other sources regardless of location. JJA is mostly impacted by African dust for sites ranging from Florida to New Jersey, while MAM is dominated by Asian dust for all sites. Mix events occurred mostly between April and October and Other events were most common outside of MAM and JJA seasons. Seven out of ten sites had Other as the most dominant source. Aerosol constituents organic carbon (OC) and elemental carbon (EC) had higher average concentrations in Other events (2.39 ± 0.78 μg m−3 and 0.79 ± 0.81 μg m−3, respectively) as compared to the other three source categories, suggestive of regional anthropogenic emissions. Moreover, the ratios of elements (Si:Al, K:Fe, Fe:Ca, Al:Ca) contributing to fine soil and PM2.5:PM10 exhibited distinct values depending on the dust source category and the site. This study builds on the growing evidence of the importance of long-range transport of dust in impacting distant regions and how a variety of sources can impact the U.S. East Coast at all times of the year.
Keywords: Dust, Asian dust, African dust, IMPROVE, EVS-3, ACTIVATE
Graphical Abstract
1. Introduction
As one of the two most abundant aerosol types globally on a mass basis, along with sea salt, dust has tremendous impacts on air quality, public health, the water cycle, radiative transfer, and the biogeochemical cycling of nutrients. Over North America, the southwestern part has received extensive attention owing to major sources of dust as part of the Mojave, Sonoran, Chihuahuan, and Great Basin Deserts (Baddock et al., 2011; Ginoux et al., 2012; Hand et al., 2016; Kavouras et al., 2009; Malm, 1992; Malm and Sisler, 2000; Rivera et al., 2010; Sorooshian et al., 2011; Tong et al., 2012). However, other parts of North America are vulnerable to dust emissions (e.g., Hand et al., 2017), including in the fine fraction of particulate matter (diameter ≤ 2.5 μm; i.e., PM2.5) that is more abundant in number concentration than larger sizes (>2.5 μm) and has the most important impact on public health (Dockery et al., 1993) and light scattering efficiency (Seinfeld and Pandis, 2016). The relative role of dust aerosol over North America is becoming increasingly important owing to reductions in other anthropogenic constituents resulting from regulatory activities (Hand et al., 2012a, 2017; Sorooshian et al., 2020).
There is a wide body of evidence for long-range dust transport from Asia and Africa impacting air quality over North America (Bozlaker et al., 2013, 2019; Chen et al., 2018; Dadashazar et al., 2019; Duce et al., 1980; Guo et al., 2017; Holzer et al., 2003; Husar et al., 2001; Jaffe et al., 2003; VanCuren, 2006; VanCuren and Cahill, 2002; Yu et al., 2012; Zhao et al., 2006). The U.S. East Coast in particular is an intriguing part of North America that does not have strong regional sources of dust in contrast to the West Coast, but there are reports of it being impacted by long-range transport from both Asia (DeBell et al., 2004; Hand et al., 2017; Zhang et al., 2019) and North Africa (Castanho et al., 2005; Perry et al., 1997; Prospero, 1999a, b; Prospero and Landing, 2009; Savoie and Prospero, 1977). While Florida is an important receptor site for African dust over the U.S. East Coast (e.g., Prospero and Landing, 2009; Zuidema et al., 2019), measurements during the Chesapeake Lighthouse and Aircraft Measurements for Satellites (CLAMS) experiment indicated that Saharan dust was responsible for 40% of fine particulate mass as far north as Virginia (Castanho et al., 2005). The impact of sources over North and Central America appears to be more limited than African and Asian dust based on the available literature. For example, mineral dust loadings over the northeastern U.S. were shown with model simulations to be governed largely by dust transport between 2 and 6 km rather than being influenced from local sources (Zhang et al., 2019).
As the U.S. East Coast receives dust from many sources, presumably the chemical ratios of crustal elements in PM2.5 will vary as there is evidence of different relative amounts of aluminum (Al), calcium (Ca), potassium (K), and iron (Fe) in soils originating in Africa versus Asia (e. g., Castanho et al., 2005; Hegg et al., 1997; Perry et al., 1997; VanCuren and Cahill, 2002). These chemical differences are significant as composition contributes to how aerosol particles interact with solar radiation and water vapor, ultimately impacting air quality, climate, and the hydrological cycle. To learn more about dust sources impacting surface air quality over the U.S. East Coast, long-term PM2.5 data at surface monitoring site are critical. Such an analysis can shed light on the relative importance of various sources influencing different parts of the U.S. East Coast as a function of time of year. In response to this research gap, the goal of this study is to characterize significant dust events at 10 sites along the East Coast with a focus on monthly frequency, the predominant sources, and chemical characteristics.
2. Methods
2.1. EPA IMPROVE
The region of analysis is the U.S. East Coast, spanning in latitude from Florida (~25°N) to Maine (~44°N), where numerous aerosol monitoring sites are positioned that are associated with the Interagency Monitoring of Protected Visual Environments (IMPROVE) network (Malm et al., 1994). Ten sites were chosen near the coast with reasonable spacing between each other to provide a representative snapshot of the entire East Coast (Fig. 1). Details related to spatial coordinates, altitude, and duration of data analyzed are in Table 1. Data used include mass concentrations for particulate matter with aerodynamic diameters less than or equal to both 10 μm (PM10) and 2.5 μm (PM2.5), along with ions and elements associated with PM2.5. These data represent 24 h samples collected every third day between January 2004 and December 2017. An exception is for the Is 52 site in New York that only had data available up to June 2010. There are numerous reports summarizing the measurement techniques and quality control and assurance details (e.g., Chow et al., 2015; Hand et al., 2012b; Malm et al., 2004; Solomon et al., 2014). Of relevance to this study, fine soil concentrations associated with PM2.5 are calculated using the following equation (e.g., Malm et al., 2004):
| (1) |
Fig. 1.
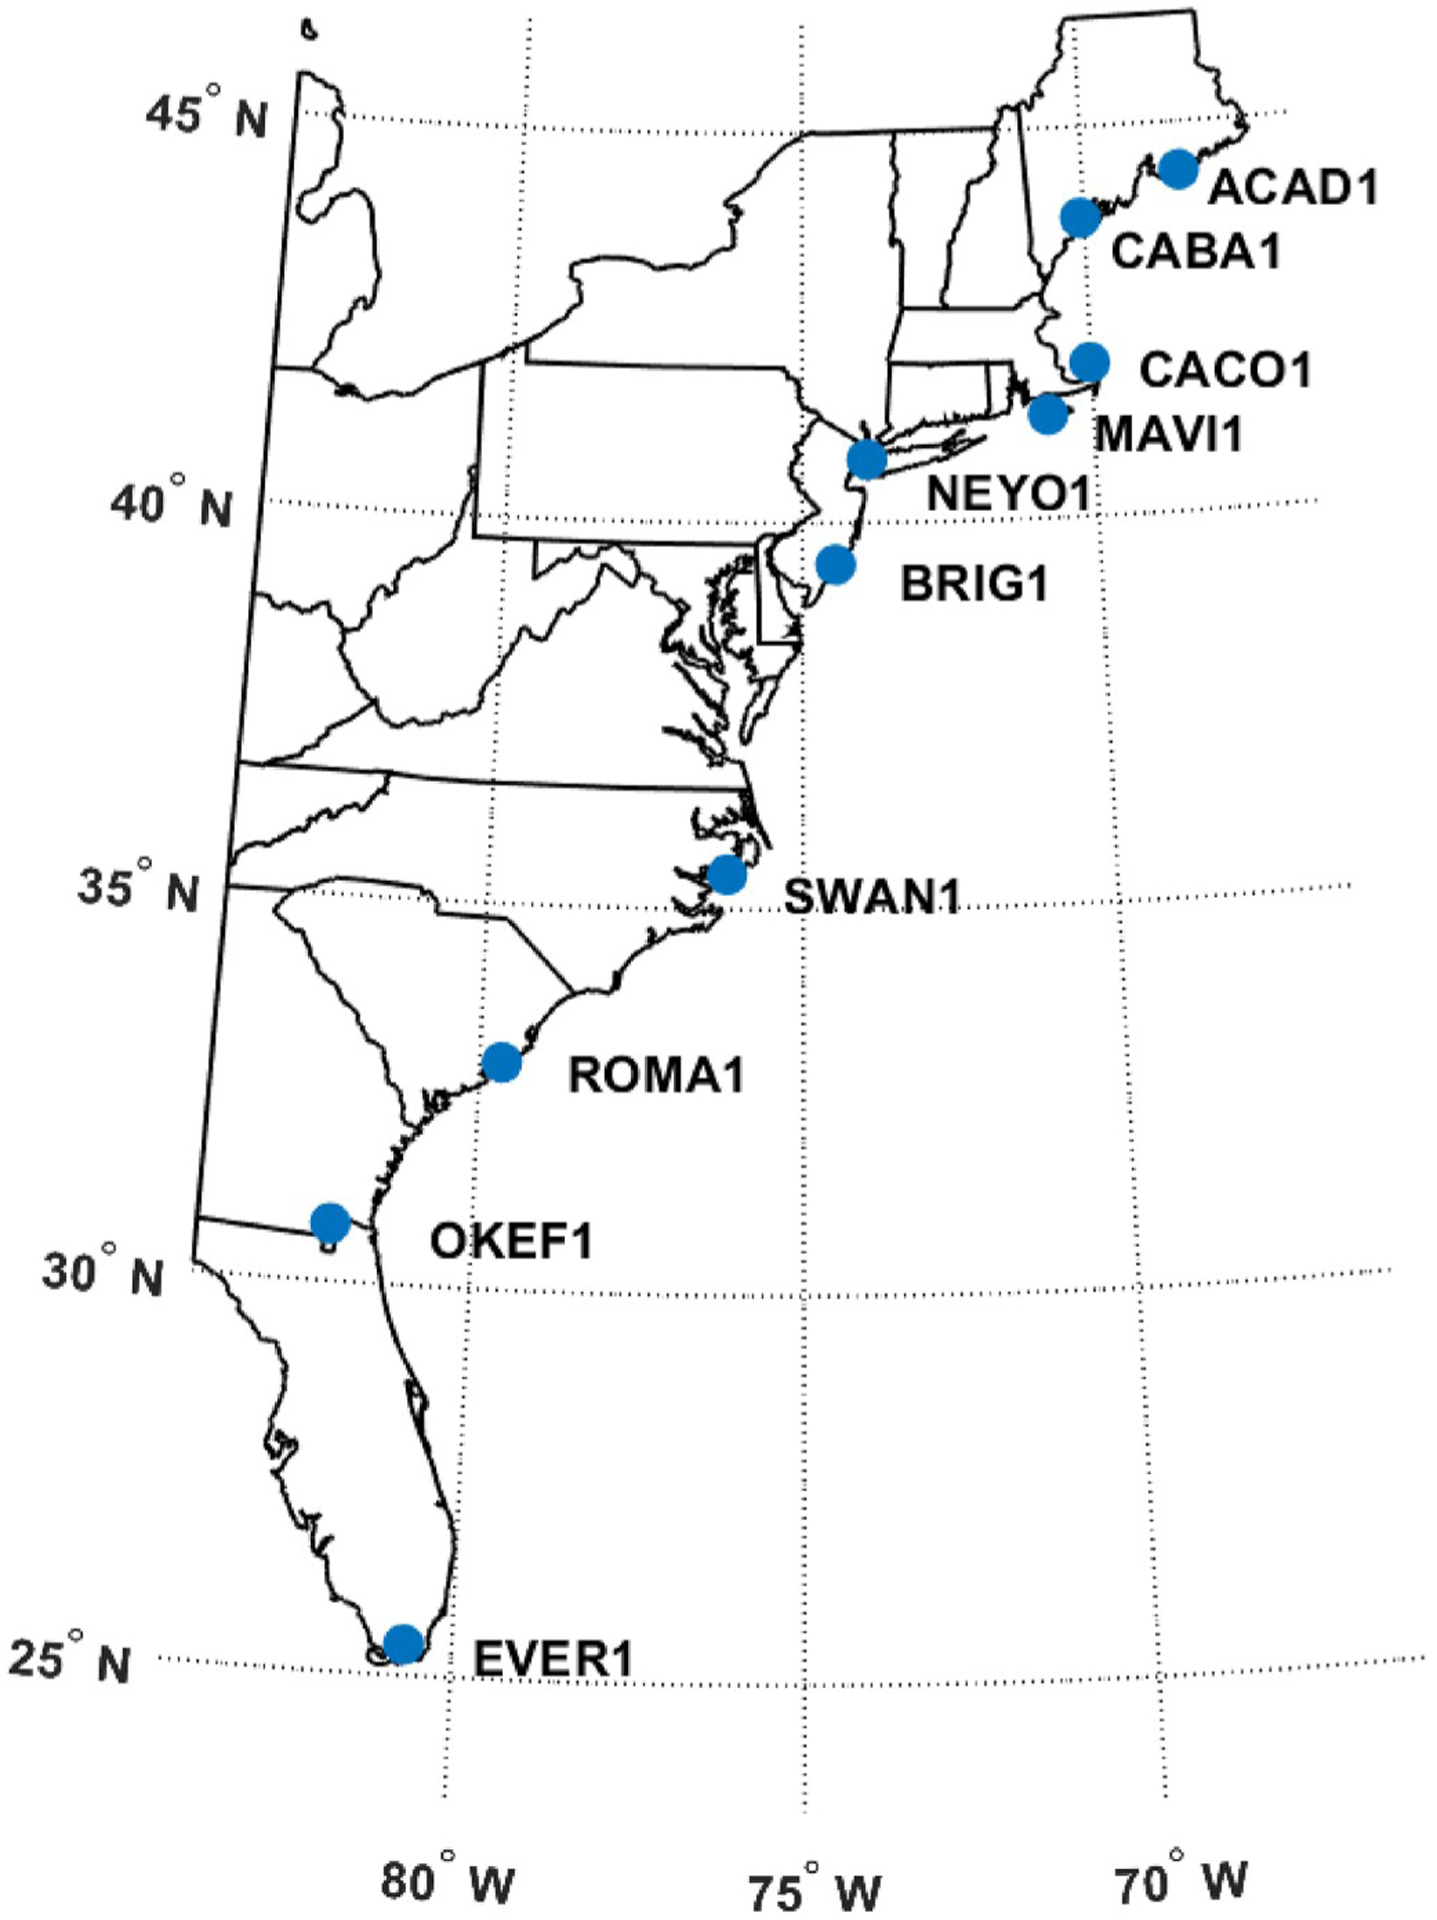
Spatial map of the 10 EPA IMPROVE sites used in this study.
Table 1.
Summary of EPA IMPROVE sites used with geographical positioning shown in Fig. 1. Data were examined between 1 January 2004 to 27 December 2017 for each site except for NEYO1*, which was examined between 1 January 2004 to 7 June 2010 (data was unavailable after 2010). AMSL = above mean sea level.
| Site Names | Site Code | State | Lat[°] | Lon[°] | Alt (m) AMSL |
|---|---|---|---|---|---|
| Acadia NP | ACAD1 | ME | 44.38 | −68.26 | 157 |
| Casco Bay | CABA1 | ME | 43.83 | −70.06 | 26 |
| Cape Cod | CACO1 | MA | 41.98 | −70.02 | 49 |
| Martha’s Vineyard | MAVI1 | MA | 41.33 | −70.78 | 2 |
| Is 52 | NEYO1* | NY | 40.82 | −73.90 | 45 |
| Brigantine NWR | BRIG1 | NJ | 39.47 | −74.45 | 5 |
| Swanquarter | SWAN1 | NC | 35.45 | −76.21 | −3 |
| Cape Romain NWR | ROMA1 | SC | 32.94 | −79.66 | 4 |
| Okefenokee NWR | OKEF1 | GA | 30.74 | −82.13 | 48 |
| Everglades NP | EVER1 | FL | 25.39 | −80.68 | 1 |
The components of this equation are based on previous work comparing re-suspended soils and ambient aerosols over the Western U. S. (Cahill et al., 1981; Pitchford et al., 1981). However, as this study is focused on extreme cases of dust concentrations and additionally relies on alternative means of confirming the presence of dust, this equation is sufficient for the purposes of this study even if variations exist in the studied dust events relative to factor contributions in Equation (1).
2.2. Criteria for dust event identification
Criteria was defined to identify specific days at each site with pronounced levels of fine soil. We follow the same method applied over the southwestern part of the U.S. (Lopez et al., 2016) and other regions such as the Mediterranean basin (Gkikas et al., 2009). More specifically, we calculate the mean and standard deviation of fine soil concentration for each month at each site. The mean plus two times the standard deviation of fine soil concentrations is used as a threshold for each month and site, above which any individual 24 h data point is considered a ‘dust event’. This method consequently isolates those dust events amounting to being in the 92nd percentile and higher for each site per month as summarized in Table S1. Therefore, results of this study are sensitive to this criteria such that the focus is only on events with anomalously high fine soil levels for a particular month and site.
2.3. Source identification
Once criteria from Section 2.2 were met, the next step was to assign that dust event to a specific source. Multiple methods were used to provide support for the dominant source of fine soil impacting the IMPROVE sites. The first method involved using back-trajectories computed with the Hybrid Single-Particle Lagrangian Integrated Trajectory (HYSPLIT) model (Rolph, 2016; Stein et al., 2015) at ending altitudes of 500, 1000, and 2500 m above ground level for each dust event identified at a specific IMPROVE site. Three different altitudes were used to help with source identification, especially in cases where two sources may have been impactful. Similar altitudes (500, 1000, 3000 m) have been used in previous source origin analysis studies (Crosbie et al., 2014; Sorooshian et al., 2011). As sources for the dust could have been far away and in other continents, 315 h back-trajectories were obtained, which is the upper limit of the HYSPLIT website but still sufficient for purposes of this study. For context, a recent study tracking North American biomass burning plumes transported to the northeastern U.S. relied on 240 h HYSPLIT back-trajectories (Rogers et al., 2020). Trajectories were obtained using the National Centers for Environmental Prediction/National Center for Atmospheric Research (NCEP/NCAR) reanalysis data coupled to the “Model vertical velocity” method.
The Navy Aerosol Analysis and Prediction System (NAAPS) was used to provide information about dust transport pathways using a time lapse of dust optical depth spatial imagery (Lynch et al., 2016; https://www.nrlmry.navy.mil/aerosol/). NAAPS relies on global meteorological fields from the Navy Global Environmental Model (NAVGEM) (Hogan et al., 2014). NAAPS has been used extensively to study long-range transport of dust to North America (Cottle et al., 2013; Lopez et al., 2016; McKendry et al., 2007; Wells et al., 2007; Wu et al., 2015).
Reanalysis data were also used from the Modern Era-Retrospective Analysis for Research and Applications (MERRA-2) model with 0.5° × 0.625° spatial resolution (Gelaro et al., 2017). More specifically, the “DUCMASS25” product was used (Bosilovich et al., 2016), which provides information about dust column mass density for PM2.5 (units of kg m−2). These data were stitched together over time to provide animated images of how dust moved leading up to the date of a dust event identified at an IMPROVE site.
Sources were categorized into four groups: Asian, African, Mix (i.e., both Asian and African), and Other (i.e., neither Asian nor African). We note that while this study is not focused on identifying the exact source of each Other event, they generally are rooted in emissions over North or Central America, and sometimes even linked to biomass burning periods as will be shown. Examples of each source category are provided in Section 3.1 to demonstrate how the aforementioned data products were used collectively to identify sources. For one of the case studies, the spatial distribution of fires is shown over North America using the Fire Information for Resource Management System (FIRMS), which provides active fire data within 3 h of satellite observations from both the Moderate Resolution Imaging Spectroradiometer (MODIS) and the Visible Infrared Imaging Radiometer Suite (VIIRS). Furthermore, that case study involved the use also of the MERRA-2 “BCCMASS” product (Bosilovich et al., 2016) for further confirmation of the presence of biomass burning emissions. That product provides black carbon column mass density for PM2.5 (units of kg m−2). Lastly, it is noted that Asian dust events could have had additional contribution (albeit believed to be more minor) from dust sources over North America as these areas are on the transport path from Asia to the U.S. East Coast.
3. Results and discussion
3.1. Case studies
A series of four case studies are first profiled to demonstrate both the techniques used to identify each of the dust sources used in this study and to compare some general features. The first example is an African dust case that qualified as a dust event on 3 August 2006 at seven sites across the East Coast ranging from as far south as EVER1 to as far north as CACO1 (Table 2). Fine soil concentrations were the highest at the two southernmost sites (OKEF1 = 12.46 μg m−3, EVER1 = 9.85 μg m−3) in contrast to all sites farther north (≤3.65 μg m−3). HYSPLIT back-trajectories clearly show the sampled air mass originating from northern Africa (Fig. 2a). Both NAAPS and MERRA-2 visual data (Fig. 2b–e) relevant to dust show a significant plume being transported from northern Africa to the U.S. East Coast.
Table 2.
Summary of fine soil concentrations (μg m−3) for each IMPROVE site for the case studies profiled in Figs 2–5. Values that are not underlined indicate sites that did not qualify as having dust events, defined as having a fine soil concentration exceeding the mean plus two times the standard deviation of fine soil concentration for a specific month and site.
| Date | Source | ACAD1 | CABA1 | CACO1 | MAVI1 | NEYO1 | BRIG1 | SWAN1 | ROMA1 | OKEF1 | EVER1 |
|---|---|---|---|---|---|---|---|---|---|---|---|
| 3-Aug-06 | African | 0.20 | 0.21 | 0.11 | 2.32 | 2.43 | 2.37 | 2.63 | 3.65 | 12.46 | 9.85 |
| 23-Apr-10 | Asian | 0.94 | 0.85 | 0.82 | 1.04 | 2.17 | 1.58 | 2.21 | 1.57 | 2.08 | 0.57 |
| 2-May-10 | Mix | 1.11 | 0.98 | 0.09 | 1.27 | 2.26 | 2.38 | 0.54 | 0.52 | 3.29 | 3.64 |
| 1-Mar-04 | Other | 0.31 | 0.49 | 0.60 | NA | NA | 0.53 | NA | 0.18 | 0.29 | 0.17 |
Fig. 2.
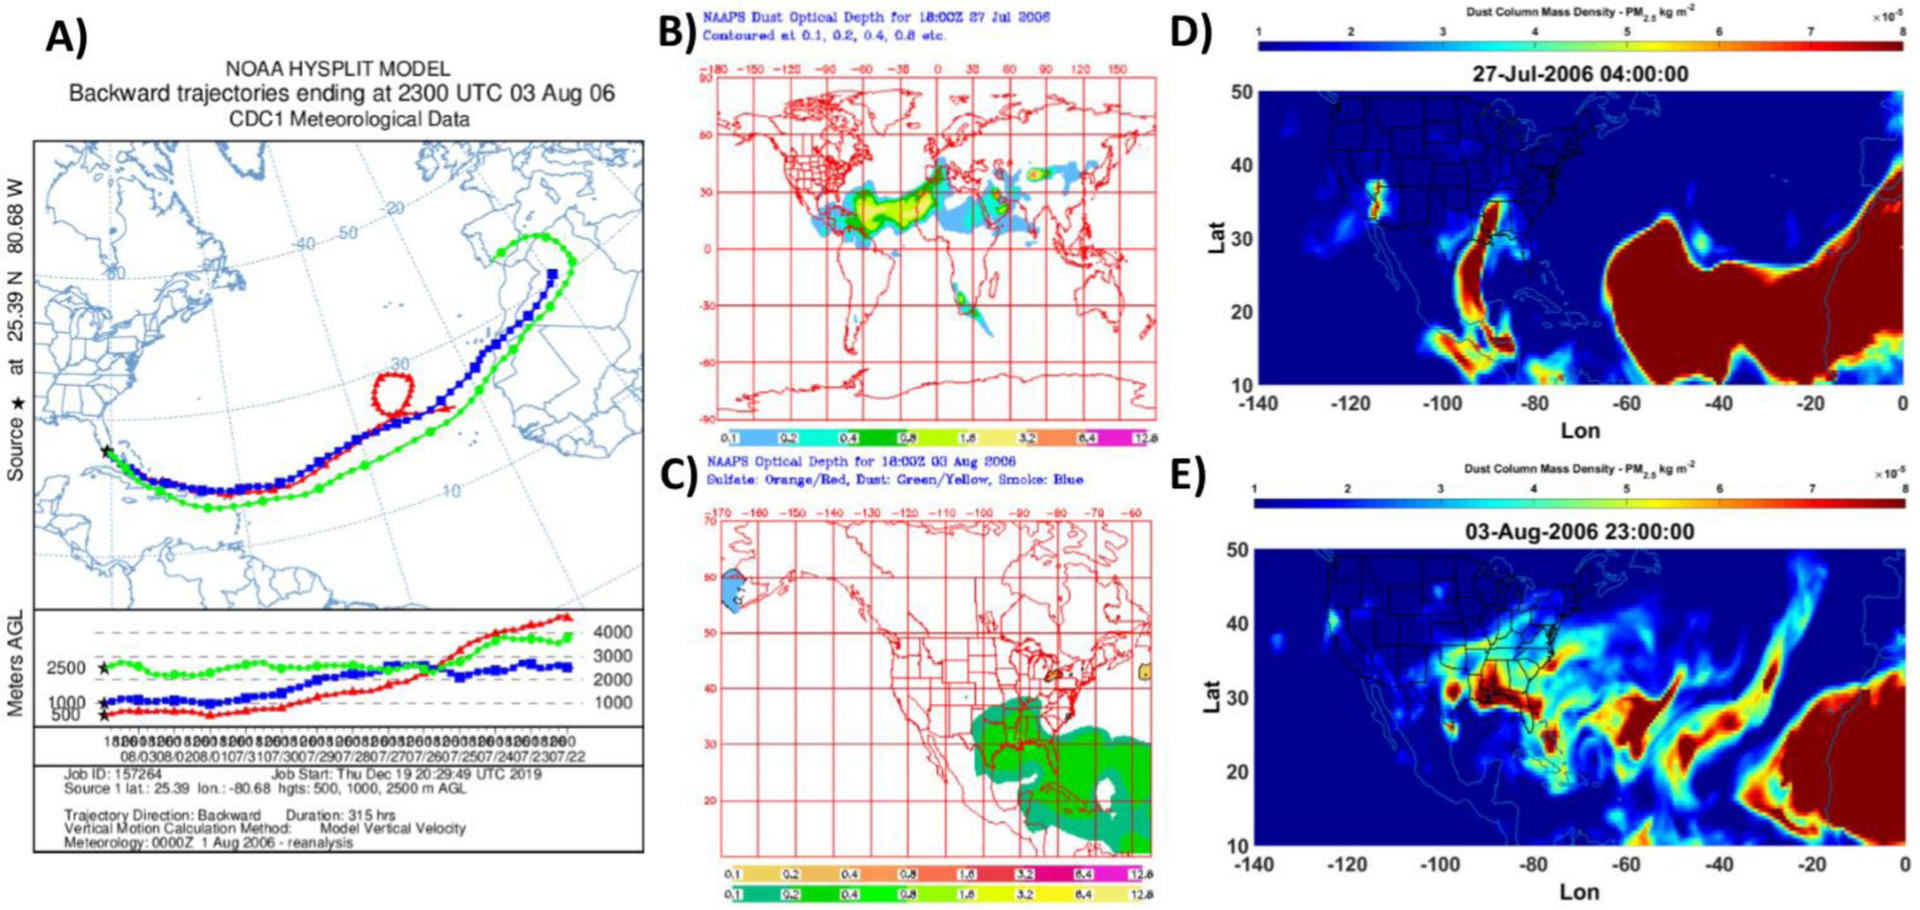
Case study features associated with an African dust event detected on 3 August 2006 by seven IMPROVE sites (see Table 2). (a) 315 h air mass back-trajectory ending at the EVER1 IMPROVE site. (b) NAAPS speciated optical depths one week before the dust event day. (c) Same as (b) except for the dust event day and zoomed in over the study region. (d) MERRA-2 dust column mass density one week before the dust event day. (e) Same as (d) except for the dust event day.
The next case on 23 April 2010 is an Asian dust plume registering as a dust event at nine sites on the East Coast (Fig. 3). The lone site not qualifying as a dust event was the southernmost site (EVER1), which exhibited markedly lower fine soil levels (0.57 μg m−3) as compared to the other sites (0.82–2.21 μg m−3). The data products shown collectively confirm that the dust was not linked to an African source but rather had influence from Asia.
Fig. 3.
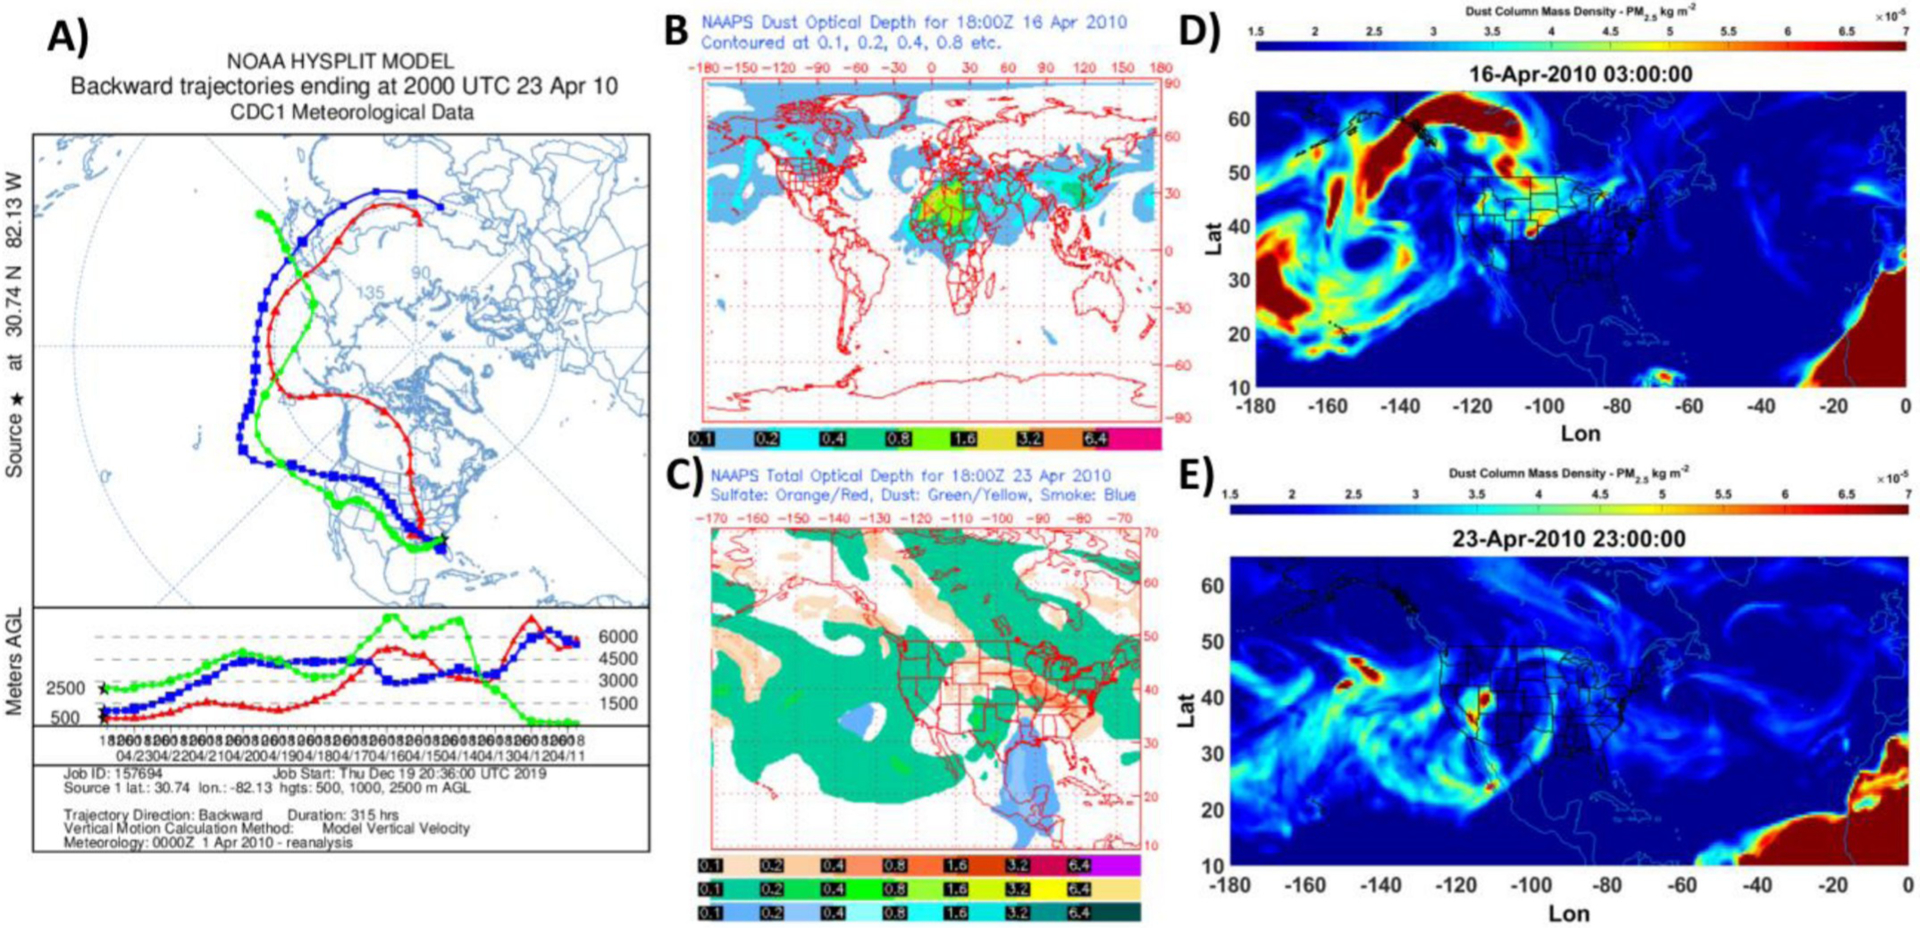
Case study features associated with an Asian dust event detected on 23 April 2010 by nine IMPROVE sites (see Table 2). (a) 315 h air mass back-trajectory ending at the OKEF1 IMPROVE site. (b) NAAPS speciated optical depths one week before the dust event day. (c) Same as (b) except for the dust event day and zoomed in over the study region. (d) MERRA-2 dust column mass density one week before the dust event day. (e) Same as (d) except for the dust event day.
Fig. 4 shows a Mix case on 2 May 2010 with data indicating there was influence from both Asian and African dust as HYSPLIT, NAAPS, and MERRA-2 show signs of transport from both source regions to the East Coast. Eight total sites (excluding SWAN1 and ROMA1) qualified as having dust events. The two southernmost sites (EVER1 and OKEF1) exhibited higher fine soil levels (3.29–3.64 μg m−3) than the six northernmost sites (0.09–2.38 μg m−3), suggestive of the former and latter being more influenced by African and Asian dust, respectively. It is difficult with this and other Mix cases to quantify the relative influence of Asian and African dust at various sites along the East Coast.
Fig. 4.
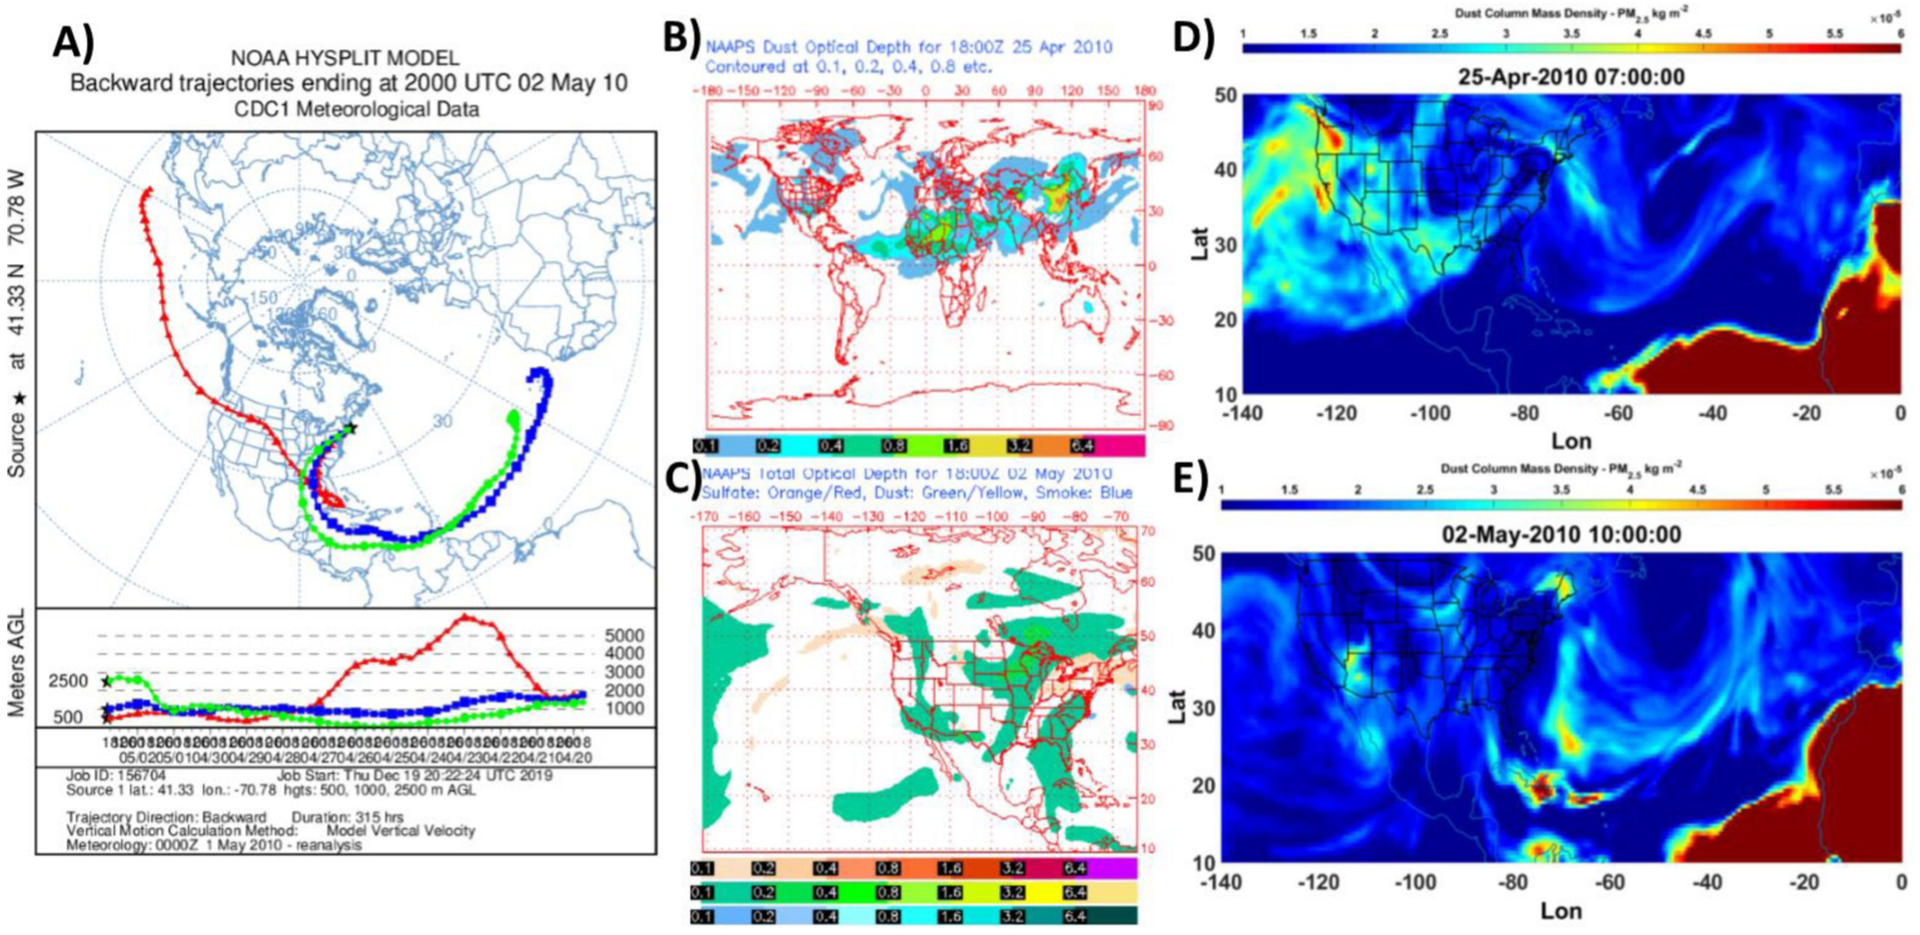
Case study features associated with “Mix” event (i.e., both African and Asian dust) detected on 2 May 2010 by eight IMPROVE sites (see Table 2). (a) 315 h air mass back-trajectory ending at the MAVI1 IMPROVE site. (b) NAAPS speciated optical depths one week before the dust event day. (c) Same as (b) except for the dust event day and zoomed in over the study region. (d) MERRA-2 dust column mass density one week before the dust event day. (e) Same as (d) except for the dust event day.
Fig. 5 shows an Other case occurring on 1 March 2004, which qualified as a dust event at two sites (CABA1 and CACO1) with fine soil levels between 0.49 and 0.60 μg m−3, respectively. Back-trajectory data reveal influence from continental North America, which coincided with periods of biomass burning in various parts of the U.S. and Canada as demonstrated by the fire spots in Fig. 5c and the black carbon column mass density map in Fig. 5d. IMPROVE data showed a clear peak in organic carbon (OC), nitrate, and potassium on the dust event day relative to periods before and after 1 March 2004 (Fig. 5b). These three species have been previously linked to biomass burning (Reid et al., 2005; Schlosser et al., 2017). Therefore, there is some support for this dust event day being linked to dust aerosol entrained and transported in biomass burning plumes.
Fig. 5.
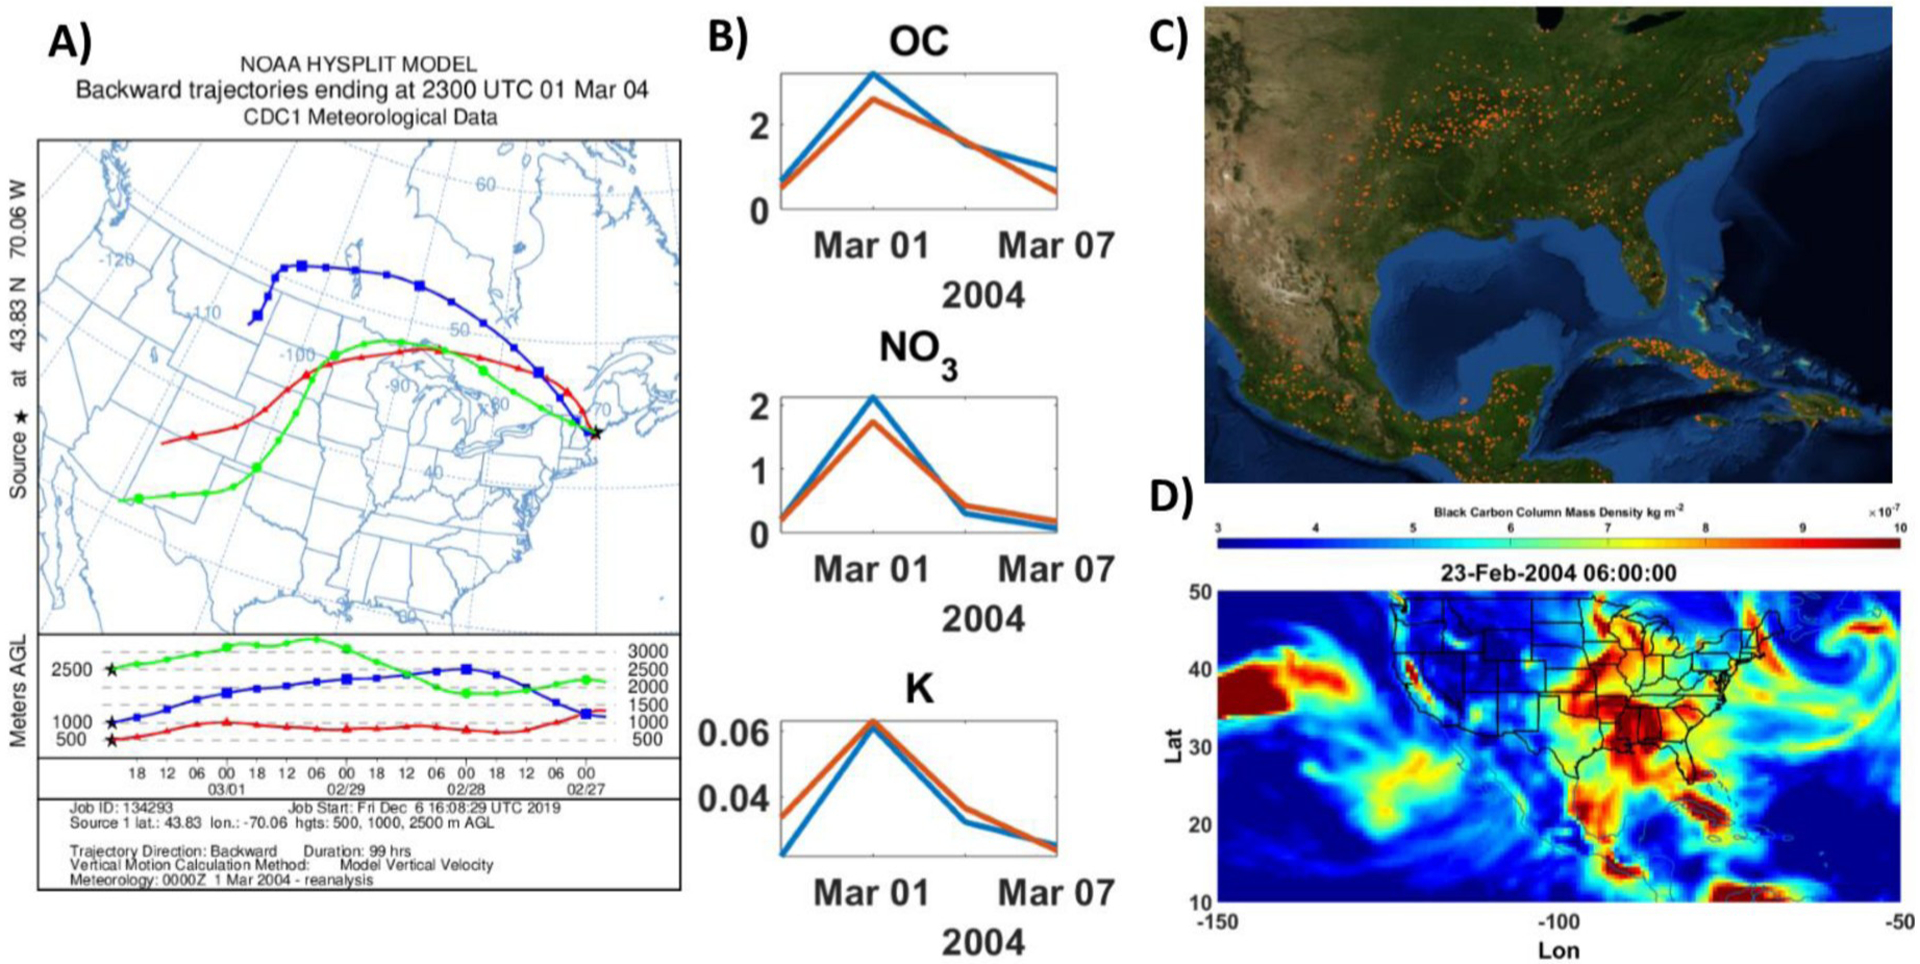
Case study features associated with an “Other” event detected on 1 March 2004 by two IMPROVE sites (see Table 2). (a) 99 h air mass back-trajectory ending at the CABA1 IMPROVE site. (b) IMPROVE data for different biomass burning tracer species leading up to and after the dust day. (c) FIRMS fire spot data for the duration of time between 25 February - 1 March 2004. (d) MERRA-2 black carbon column mass density one week before the dust event day.
3.2. Cumulative dust event statistics
The ten sites examined had between 3.3% and 4.6% of their total possible days of available data qualify as dust events (Table 3). All sites had 1704 total possible days of data except for NEYO1 (713 days), which only had data up to June 2010 rather than December 2017 like all other sites. ACAD1 (Maine) and NEYO1 (New York) both had the most relative number of total days qualify as dust events (4.6%), whereas SWAN1 (North Carolina) and EVER1 (Florida) had the lowest relative amount of days qualify (3.3% and 3.8%, respectively). There is a separation between the dominant source region of dust for events moving from higher to lower latitudes. More specifically, between ACAD1 (44.38°N) and MAV1 (41.33°N), the majority of the dust events were categorized as having Other sources (52–72% of total dust events), followed by Asian (22–33%), African (4–12%), and then Mix (1–6%). The two sites with intermediate latitudes, NEYO1 (40.82°N) and BRIG1 (39.47°N), had most of their dust events categorized as Asian (52–53%), followed by Other (28–33%), African (15–17%), and Mix (0–3%). Lastly, between SWAN1 (35.45°N) and EVER1 (25.39°N), the predominant sources were Other (35–46%) and African (28–49%), followed by Asian (11–19%) and Mix (1–10%). Thus, the relative importance of different sources contributing to dust events varied by latitude. More specifically, dust events categorized as Other and Asian collectively were more prevalent from New Jersey to the north, while African and Other were most important from North Carolina to the south (Table 3).
Table 3.
Source of dust events at each site. For context, “Total” represents the total number of days with data at each site for the durations shown in Table 1. “Dust events” are the subset of days that exceeded the threshold fine soil concentration for a particular month. The subsequent four columns to the right further categorize the dust events into specific sources. Mix represents influence from both African and Asian dust, whereas Other indicates no influence from either of those two.
| Site | Total | Dust events | African | Asian | Other | Mix |
|---|---|---|---|---|---|---|
| ACAD1 | 1704 | 78 | 5 | 22 | 46 | 5 |
| CABA1 | 1704 | 72 | 3 | 16 | 52 | 1 |
| CACO1 | 1704 | 72 | 7 | 24 | 38 | 3 |
| MAVI1 | 1704 | 67 | 8 | 22 | 35 | 2 |
| NEYO1 | 713 | 33 | 5 | 17 | 11 | 0 |
| BRIG1 | 1704 | 72 | 12 | 38 | 20 | 2 |
| SWAN1 | 1704 | 57 | 22 | 11 | 21 | 3 |
| ROMA1 | 1704 | 69 | 26 | 11 | 31 | 1 |
| OKEF1 | 1704 | 71 | 20 | 11 | 33 | 7 |
| EVER1 | 1704 | 65 | 32 | 7 | 23 | 3 |
Overall fine soil concentrations ranged widely for dust events based on the IMPROVE site and the source region (Table 4). There was a general increase in fine soil concentrations for the African and Asian source categories towards the southern part of the East Coast with the highest values at the EVER1 site and lowest values at ACAD1. Other and Mix categories exhibited more variability as a function of latitude. With the exception of the OKEF1 site, the Other source category exhibited the lowest fine soil levels compared to the other three sources for each site, ranging from 0.48 ± 0.16 μg m−3 at ACAD1 to 1.82 ± 0.25 μg m−3 at NEYO1. As the Other fine soil levels at NEYO1 (1.82 ± 0.25 μg m−3) and OKEF1 (1.73 ± 2.05 μg m−3) are approximately twice that of the mean value of this category (0.90 μg m−3) for the entire East Coast, there is the likelihood that there are more anthropogenic emissions of this aerosol constituent promoted by some combination of vehicular activity, construction, agriculture, and burning.
Table 4.
Average (±standard deviation) of fine soil concentration (μg m−3) at each site for the dust events originating from different sources. The blank cell indicates no available data for that category.
| Site | African | Asian | Other | Mix |
|---|---|---|---|---|
| ACAD1 | 0.92 ± 0.30 | 0.73 ± 0.20 | 0.48 ± 0.16 | 0.76 ± 0.25 |
| CABA1 | 1.69 ± 1.18 | 0.93 ± 0.31 | 0.56 ± 0.24 | 1.31 ± 0.00 |
| CACO1 | 2.49 ± 1.25 | 0.89 ± 0.29 | 0.65 ± 0.33 | 1.62 ± 0.70 |
| MAVI1 | 2.91 ± 1.02 | 0.90 ± 0.33 | 0.67 ± 0.47 | 2.77 ± 0.19 |
| NEYO1 | 2.44 ± 0.45 | 2.32 ± 0.41 | 1.82 ± 0.25 | |
| BRIG1 | 2.23 ± 0.74 | 1.35 ± 0.69 | 0.68 ± 0.29 | 1.85 ± 0.56 |
| SWAN1 | 3.65 ± 1.50 | 1.71 ± 1.55 | 0.66 ± 0.27 | 2.28 ± 1.21 |
| ROMA1 | 5.58 ± 2.07 | 1.33 ± 0.37 | 0.89 ± 0.31 | 6.00 ± 0.00 |
| OKEF1 | 7.22 ± 2.64 | 1.70 ± 0.70 | 1.73 ± 2.05 | 5.11 ± 1.56 |
| EVER1 | 10.27 ± 4.89 | 2.69 ± 1.46 | 0.86 ± 0.90 | 4.39 ± 0.67 |
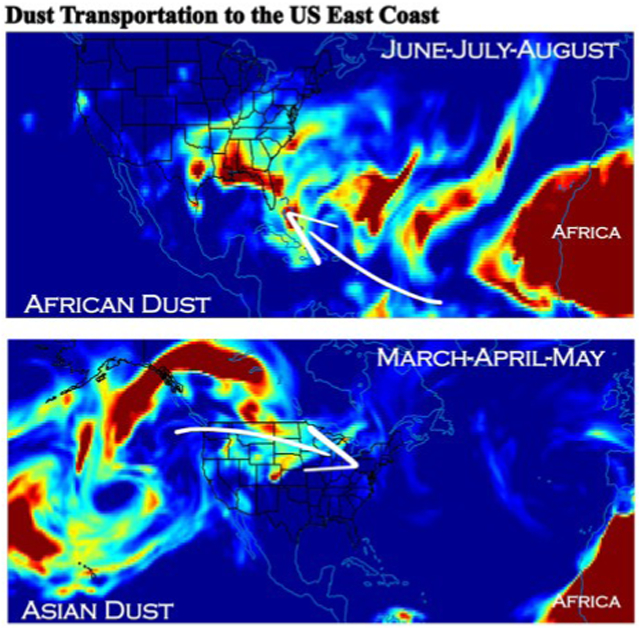
The African source category exhibited the highest fine soil levels for all sites, ranging from 0.92 ± 0.30 μg m−3 at ACAD1 to 10.27 ± 4.89 μg m−3 at EVER1. The detection of African dust as far north as ACAD1 is consistent with past reports (Perry et al., 1997). The fine soil levels in the African category exhibited a general increasing trend from the Northeast to Southeast, with the largest jump in concentration between OKEF1 (7.22 ± 2.64 μg m−3) and EVER1 (10.27 ± 4.89 μg m−3). This latitudinal gradient is consistent with previous reports (e.g., Perry et al., 1997). This is expected based on the typical transport pattern bringing North African dust to the East Coast, assisted in large part by Bermuda-Azores High that is most pronounced in its development during the summer. This climatic feature leads to anticyclonic air flow in the boundary layer, with surface winds shifting from easterly (<25°N) to being parallel to the coastline to the north of that latitude.
The Asian source category exhibited higher fine soil levels from NEYO1 (2.32 ± 0.41 μg m−3) down south to EVER1 (2.69 ± 1.46 μg m−3) in contrast to sites to the north of NEYO1 (0.73–0.90 μg m−3). In their study of Asian dust over North America, VanCuren and Cahill (2002) showed that 24-h fine soil levels were typically between 0.2 and 1 μg m−3, and rarely exceeded 5 μg m−3. In contrast, Perry et al. (1997) reported that North African dust events over the East Coast were characterized by fine soil levels usually exceeding 10 μg m−3 with mass mean diameters being < 1 μm. These low sizes are expected based on the long period of time dust needs to arrive to the East Coast (~1 week) as reported by others decades ago (Carlson and Prospero, 1972).
The Mix category includes fine soil concentrations that are typically in between those of the African and Asian categories, which are the two sources impacting data in this category. The one exception is at ROMA1, where the Mix category exhibited the highest fine soil levels (6.00 μg m−3) of any category; however, it is noted that this is based on just one event as the Mix category was a more rare phenomenon than the other dust events.
The generally higher fine soil levels in the African source category for the 10 sites is suggestive of the African source being the major input of fine soil levels across the entire East Coast, and that the NEYO1 site’s fine soil level during Asian and African events are more comparable than other sites due to the greater influence of Other sources that impact that site more than any other site.
3.3. Monthly profile of dust events and sources
As the previous section examined cumulative statistics over multiple years, here the discussion focuses on how the frequency and sources of dust events varied as a function of month. Based on a cumulative sum of dust events across all 10 sites, the March-April-May (MAM) season had the most (174), followed by June-July-August (JJA) with 172, and then by September-October-November (SON) with 160 and December-January-February (DFJ) with 150 (Table 5). The SON season had the most variability between individual months, ranging between 40 and 64 events, relative to other seasons. Conversely, the JJA season exhibited the least variability with between 55 and 60 events for its individual months.
Table 5.
Breakdown of number of dust events in each month for the 10 IMPROVE sites.
| Sites | Jan | Feb | Mar | Apr | May | Jun | Jul | Aug | Sep | Oct | Nov | Dec |
|---|---|---|---|---|---|---|---|---|---|---|---|---|
| ACAD1 | 7 | 6 | 7 | 5 | 9 | 7 | 7 | 7 | 5 | 4 | 8 | 6 |
| CABA1 | 6 | 5 | 8 | 6 | 5 | 6 | 8 | 3 | 3 | 9 | 6 | 7 |
| CACO1 | 4 | 7 | 11 | 8 | 5 | 5 | 3 | 7 | 3 | 7 | 6 | 6 |
| MAVI1 | 5 | 4 | 8 | 9 | 3 | 3 | 4 | 4 | 6 | 6 | 8 | 7 |
| NEYO1 | 2 | 2 | 3 | 4 | 2 | 3 | 3 | 3 | 3 | 4 | 3 | 1 |
| BRIG1 | 6 | 3 | 5 | 8 | 8 | 7 | 6 | 6 | 2 | 5 | 7 | 9 |
| SWAN1 | 6 | 4 | 4 | 5 | 5 | 6 | 6 | 5 | 3 | 6 | 3 | 4 |
| ROMA1 | 7 | 4 | 5 | 5 | 3 | 8 | 6 | 9 | 3 | 7 | 7 | 5 |
| OKEF1 | 5 | 1 | 7 | 6 | 5 | 6 | 8 | 8 | 5 | 7 | 7 | 6 |
| EVER1 | 3 | 7 | 4 | 4 | 7 | 4 | 6 | 8 | 7 | 1 | 9 | 5 |
| Total | 51 | 43 | 62 | 60 | 52 | 55 | 57 | 60 | 40 | 56 | 64 | 56 |
The NEYO1 site exhibited the least variability in terms of number of events per month (2.8 ± 0.9 days), consistent with it being an urban center impacted relative more by local sources (e.g., vehicular activity, construction) that are not seasonally-driven. In contrast, the sites with the most variability were EVER1 (5.4 ± 2.3 days) and CACO1 (6.0 ± 2.3 days), with the most events being in JJA (18) and MAM (24), respectively. Most sites had the majority of their events in the MAM season, primarily those to the north (BRIG1, MAVI1, CACO1, CABA1, ACAD1), where NEYO1 had the most in SON, and the four southernmost sites (SWAN1, ROMA1, OKEF1, EVER1) had the most events in JJA. There were no consistent patterns in terms of cluster of sites having more dust events in specific months or showing latitudinal trends.
There were clear trends in terms of the specific sources impacting the different sites as a function of month (Fig. 6). EVER1 is of particular interest as it in some ways represents the gateway of African dust to the East Coast based on the general trajectory of African during the spring and summer months. For this reason, Miami is considered an excellent sampling location for sampling the African dust plume reaching North America (Zuidema et al., 2019). Between June and October, African dust was the only source contributing to dust events at EVER1, with the most recorded in August (8 events). This site also had African dust events in several other months both before and after JJA (i.e., February, April-May, September-October). The high incidence of African dust events in JJA is evident at the sites to the north of EVER1 including OKEF1, ROMA1, SWAN1, and BRIG1. Similar to EVER1, OKEF1 and ROMA1 both had the most African dust events in August (7 and 9, respectively), while SWAN1 and BRIG1 had the most African events in July (6 and 5, respectively). Sites farther to the north registered African dust events generally only in JJA, with the exception of CACO1 that had a single such event in September. Therefore, these results show that the influence of African dust extends across the entire East Coast in JJA, with influence in other months most clearly observed at the southernmost sites that are closer to the African dust source. It is important to note that the transport of African dust to different parts of the East Coast, if at all, are sensitive to meteorology. More specifically, the position of the Intertropical Convergence Zone (ITCZ) is important, in addition to the strength and location of the Bermuda-Azores High (Perry et al., 1997). The latter can help guide dust to areas as far west as Texas or as far east as Bermuda (Arimoto et al., 1992, 1995; Bozlaker et al., 2019; Perry et al., 1997).
Fig. 6.
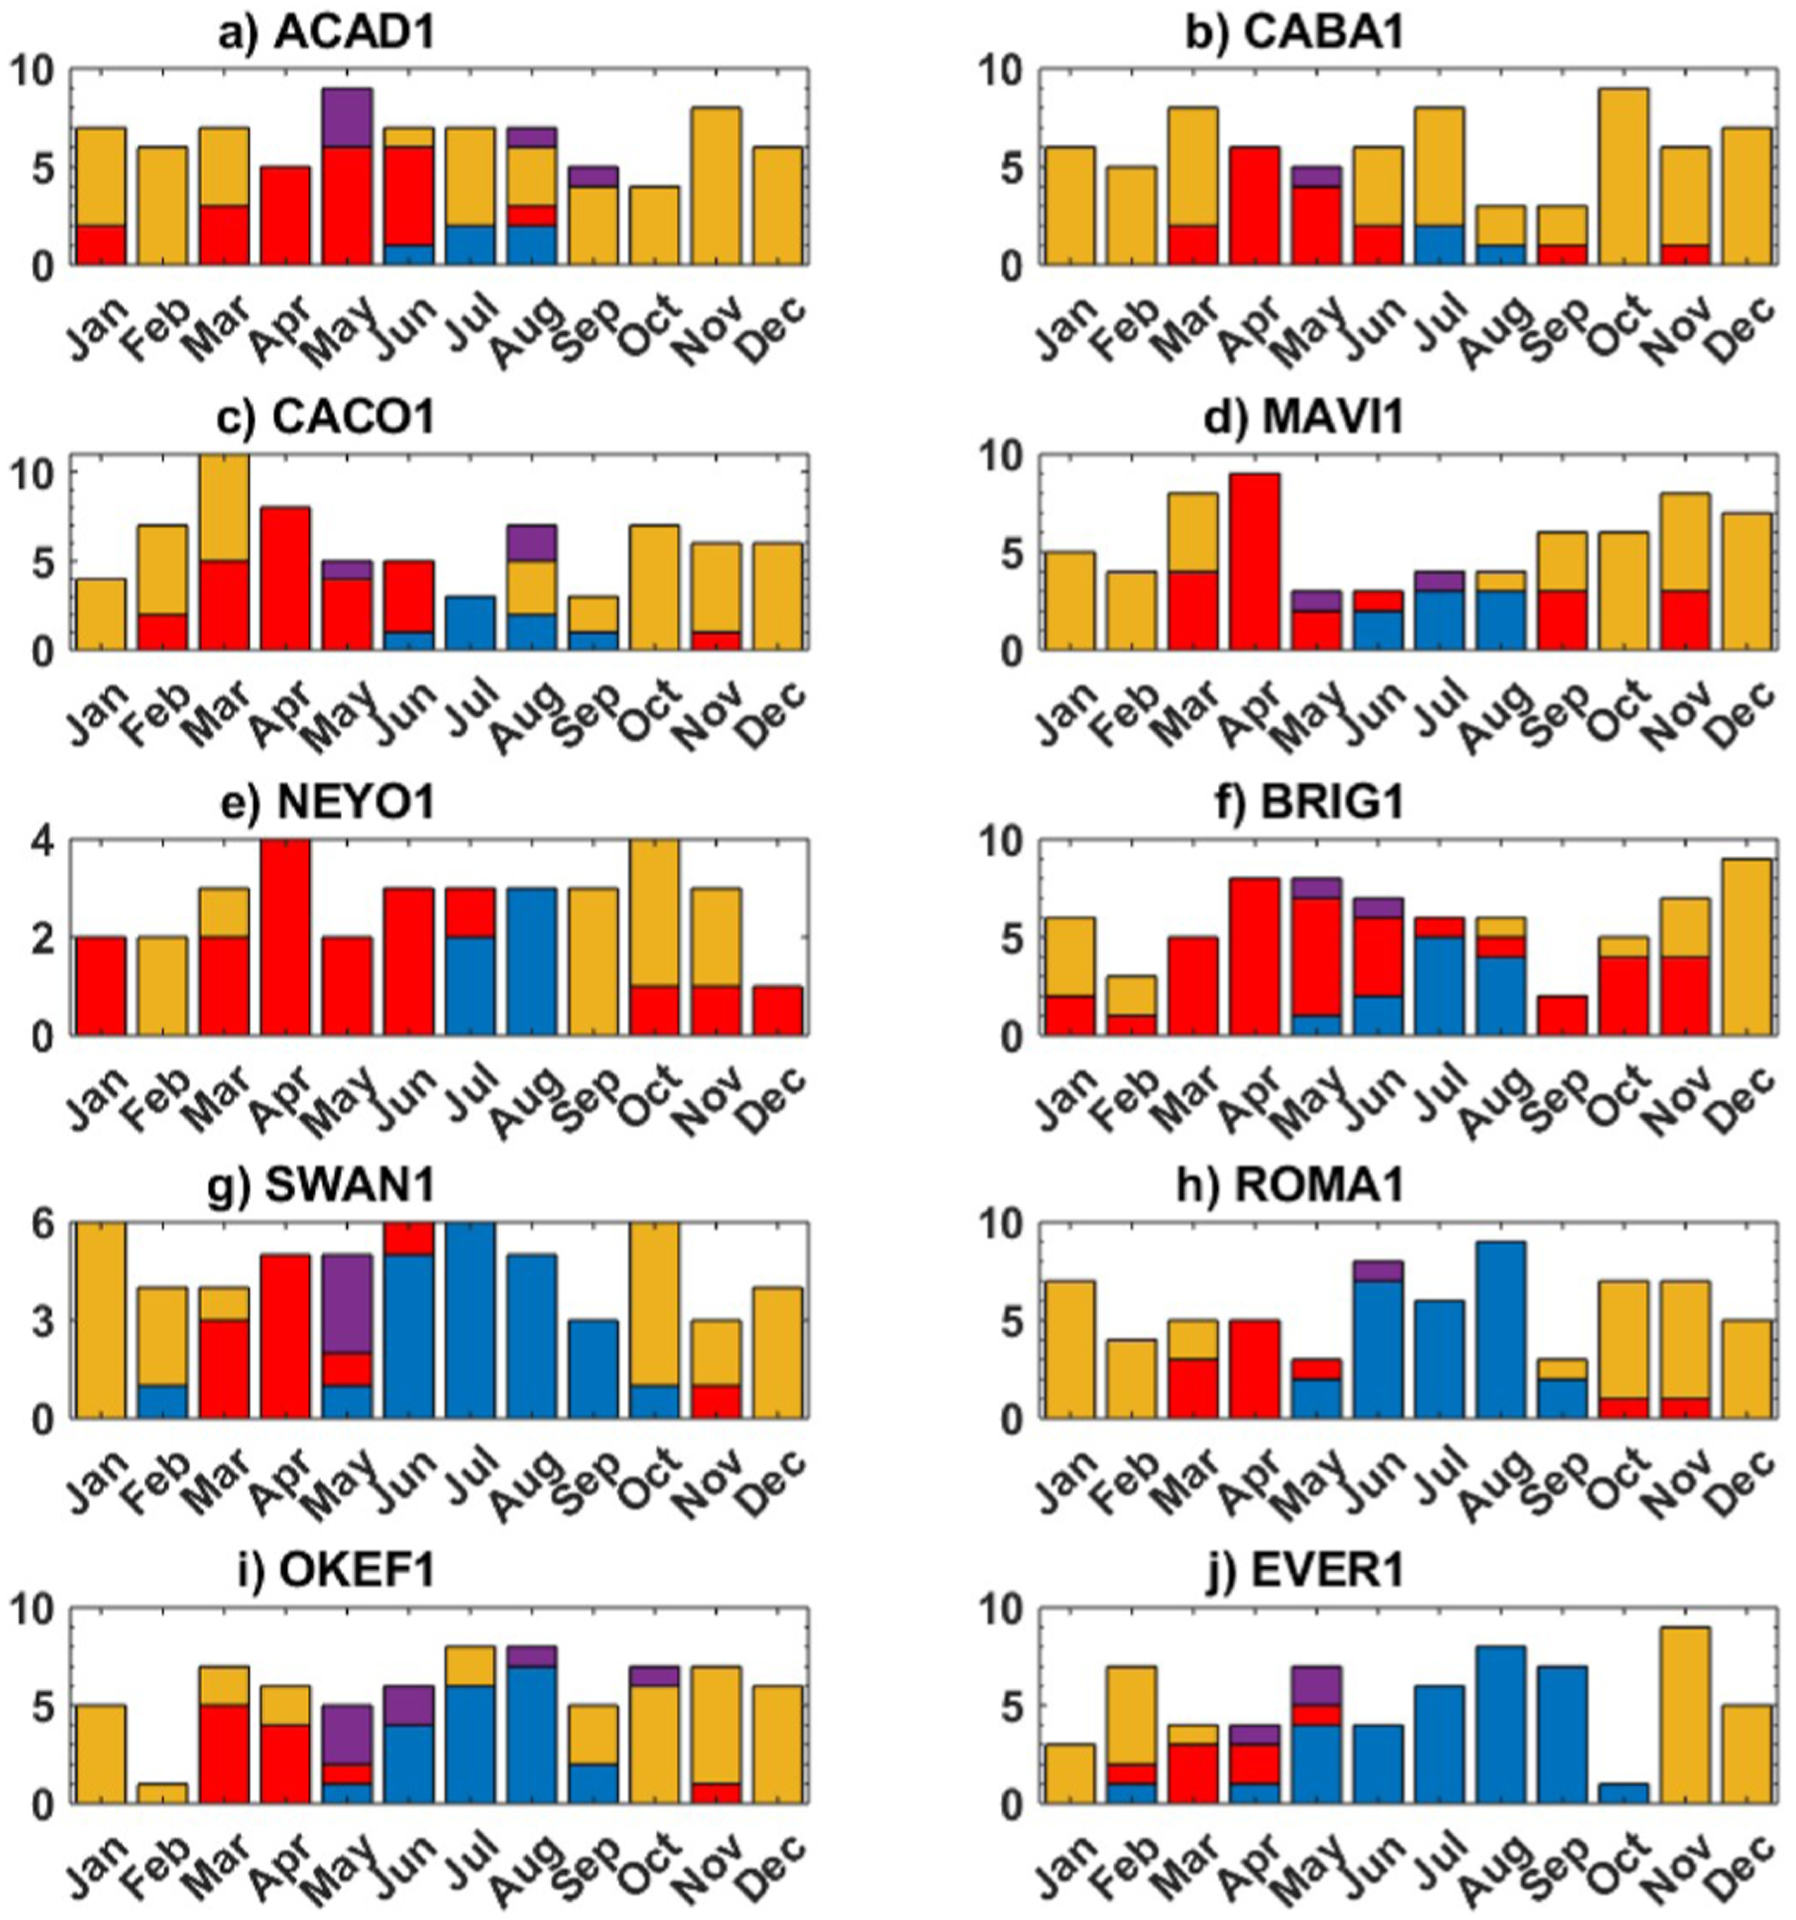
Breakdown of how many dust events originated from different sources as a function of month for each IMPROVE site. Blue = African, red = Asian, yellow = Other, purple = Mix.
Asian dust events were recorded at all sites in the season that its transport is most common (MAM). April was the month that these events were most common along the entire East Coast with the exception of ACAD1 that experienced the most events in May (6). The sites with most events in April were MAVI1 (9), and CACO1 and BRIG1 with 8 events each. Dust events qualifying as Mixed were observed between April and October, with the most in any month being 3 events at ACAD1, SWAN1, and OKEF1. Of note is that past work has shown that both Asian and African dust can be observed over North America, often impacting precipitation, year-round including even in the winter (e.g., Creamean et al., 2013).
Lastly, Other events were most common outside the MAM and JJA seasons owing to less interference from Asian and African dust events. The two northernmost sites had Other events observed in the most months (10) with the only ones not counted being April and May, due in large part likely to the overwhelming influence of Asian dust events.
3.4. Source specific chemical characteristics
3.4.1. Ratios
The chemical ratios of selected aerosol constituents were compared between the four dust source categories in Table 6. Table S2 provides more detailed statistics (standard deviation, minimum, maximum) for the ratios and also PM10. Motivation for examining these ratios is to identify if differences exist for each of the ten sites when comparing data between the four sources. Five ratios are examined here for distinguishing between different sources that have been used in several past studies referred to below: K:Fe, Si:Al, Al:Ca, Fe: Ca, PM2.5:PM10.
Table 6.
Average values of different elemental ratios (mass basis) in PM2.5, the PM2.5:PM10 mass ratio, and PM10 (μg m−3) associated with dust events for each site. The blank cell indicates no available data for that category. Table S2 provides additionally the standard deviation, minimum, and maximum values for each category shown here.
| Site | African | Asian | Other | Mix | Site | African | Asian | Other | Mix | ||
|---|---|---|---|---|---|---|---|---|---|---|---|
| K:Fe | ACAD1 | 1.09 | 1.15 | 1.67 | 0.85 | Si:Al | ACAD1 | 3.53 | 3.03 | 3.20 | 2.52 |
| CABA1 | 1.26 | 1.05 | 1.75 | 0.54 | CABA1 | 3.39 | 3.02 | 2.66 | 2.44 | ||
| CACO1 | 0.56 | 1.21 | 1.47 | 0.73 | CACO1 | 2.29 | 3.39 | 3.82 | 2.13 | ||
| MAVI1 | 0.56 | 1.35 | 2.04 | 0.49 | MAVI1 | 2.38 | 3.48 | 3.56 | 2.00 | ||
| NEYO1 | 0.35 | 0.33 | 0.28 | NEYO1 | 2.39 | 2.82 | 3.13 | ||||
| BRIG1 | 0.59 | 1.01 | 1.25 | 0.54 | BRIG1 | 2.36 | 3.11 | 3.46 | 1.96 | ||
| SWAN1 | 0.47 | 1.18 | 2.07 | 0.62 | SWAN1 | 2.04 | 2.93 | 3.03 | 1.97 | ||
| ROMA1 | 0.42 | 1.39 | 1.71 | 0.35 | ROMA1 | 1.96 | 2.58 | 2.57 | 1.98 | ||
| OKEF1 | 0.39 | 1.18 | 1.44 | 0.41 | OKEF1 | 1.90 | 2.64 | 2.51 | 1.99 | ||
| EVER1 | 0.39 | 1.03 | 7.15 | 0.49 | EVER1 | 1.92 | 2.03 | 2.67 | 2.10 | ||
| Al:Ca | ACAD1 | 2.97 | 1.65 | 1.54 | 2.94 | Fe:Ca | ACAD1 | 1.70 | 1.18 | 1.23 | 1.72 |
| CABA1 | 4.35 | 1.83 | 1.61 | 3.49 | CABA1 | 1.98 | 1.31 | 1.44 | 2.24 | ||
| CACO1 | 3.40 | 1.36 | 1.09 | 3.51 | CACO1 | 1.96 | 1.09 | 1.21 | 1.80 | ||
| MAVI1 | 3.12 | 1.26 | 0.67 | 3.80 | MAVI1 | 1.91 | 1.03 | 0.92 | 2.21 | ||
| NEYO1 | 2.09 | 0.69 | 0.40 | NEYO1 | 1.96 | 1.53 | 1.61 | ||||
| BRIG1 | 3.28 | 1.75 | 1.25 | 3.26 | BRIG1 | 1.98 | 1.32 | 2.09 | 1.96 | ||
| SWAN1 | 3.80 | 1.66 | 1.38 | 2.98 | SWAN1 | 2.13 | 1.01 | 0.95 | 1.65 | ||
| ROMA1 | 4.20 | 1.25 | 1.59 | 5.94 | ROMA1 | 2.19 | 0.80 | 1.76 | 3.09 | ||
| OKEF1 | 4.42 | 1.47 | 1.95 | 4.28 | OKEF1 | 2.24 | 0.88 | 1.15 | 2.27 | ||
| EVER1 | 4.55 | 1.50 | 1.10 | 4.30 | EVER1 | 2.34 | 0.88 | 0.54 | 2.51 | ||
| PM2.5:PM10 | ACAD1 | 0.79 | 0.60 | 0.67 | 0.65 | PM10 | ACAD1 | 21.26 | 13.91 | 13.51 | 10.13 |
| CABA1 | 0.73 | 0.66 | 0.71 | 0.57 | CABA1 | 27.54 | 14.61 | 15.55 | 10.57 | ||
| CACO1 | 0.61 | 0.64 | 0.65 | 0.72 | CACO1 | 17.98 | 17.37 | 16.51 | 17.43 | ||
| MAVI1 | 0.58 | 0.59 | 0.57 | 0.21 | MAVI1 | 26.76 | 20.55 | 23.72 | 58.05 | ||
| NEYO1 | 0.67 | 0.59 | 0.65 | NEYO1 | 31.96 | 36.52 | 39.40 | ||||
| BRIG1 | 0.55 | 0.54 | 0.64 | 0.60 | BRIG1 | 29.64 | 26.62 | 26.43 | 15.49 | ||
| SWAN1 | 0.51 | 0.54 | 0.68 | 0.47 | SWAN1 | 19.81 | 22.36 | 17.04 | 19.25 | ||
| ROMA1 | 0.47 | 0.57 | 0.66 | 0.50 | ROMA1 | 25.72 | 22.38 | 17.80 | 21.10 | ||
| OKEF1 | 0.52 | 0.58 | 0.56 | 0.51 | OKEF1 | 24.99 | 21.93 | 20.70 | 21.19 | ||
| EVER1 | 0.48 | 0.29 | 0.57 | 0.45 | EVER1 | 34.49 | 47.39 | 16.48 | 22.99 |
The Si:Al ratio showed unique behavior for the African dust category as it increased progressively in value from south (EVER1 = 1.92) to the north (ACAD1 = 3.53). For contextual purposes, ratio values reported in other regions are important to note. In their analysis of PM10 over Europe for summer 2012 and winter 2–13, Alastuey et al. (2016) showed that the average Si:Al ratio was 2.34. They observed a summertime gradient from 2.4 to 2.9 to 2.0–2.2 when moving from eastern to western Europe, respectively, with most influence from Saharan dust outbreaks in the summertime and over central and western Europe. Measurements in Italy reported reduced values of the Si:Al ratio in Saharan dust events (≤2.5) as compared to other periods (>2.5) (Blanco et al., 2003; Marenco et al., 2006; Nava et al., 2012). Measurements of the Si:Al ratio for African dust in Tenerife, Spain (2.14) (Kandler et al., 2007), Cape Verde Islands (2.03–2.32) (Chiapello et al., 1997; Formenti et al., 2003), Puerto Rico (2.13) (Reid et al., 2003), and Illinois (2.0) (Gatz and Prospero, 1996) were also below 2.5. This is not surprising based on earlier reports of North African dust being relatively rich in Al compared to at least North American dust (Bozlaker et al., 2013; Gatz and Prospero, 1996; Hand et al., 2017; Shelley et al., 2015). Only the two northernmost sites exhibited Si:Al ratios above 2.5 (3.39–3.53). The Si: Al ratio was on average higher for Asian and Other across the East Coast with values of 2.90 ± 0.42 and 3.06 ± 0.46, respectively, as compared to African dust events (2.42 ± 0.59). This is consistent with high values of Si:Al (2.79–3.9) in various studies of Chinese dust (Alfaro et al., 2003; Zhang et al., 1998). Mix, on the other hand, exhibited the lowest mean Si:Al ratio (2.12 ± 0.21). That the Si:Al ratio for the African category increased progressively up towards the north of the East Coast is suggestive of mixing of the African plume during its northward transport with air masses exhibiting varying crustal signatures.
The Al:Ca ratio was on average highest for the African (3.62 ± 0.79) and Mix (3.83 ± 0.93) categories. The ratio for African dust generally was highest at the southernmost sites (EVER1 = 4.55) and decreased gradually to the north (ACAD1 = 2.97) with the exception of high values at CABA1 (4.35). The Al:Ca ratio was on average much lower for Asian (1.44 ± 0.33) and Other (1.26 ± 0.46) dust events without any clear latitudinal trend. There are reports of the Al:Ca ratio for African dust in various studies: 3.57 at Tenerife, Spain (Kandler et al., 2007), 1.67–5.00 at Cape Verde Islands (Chiapello et al., 1997; Formenti et al., 2003), 0.41–0.62 in central Italy (Nava et al., 2012), 3.45 at Barbados (Arimoto et al., 1995), and 3.33 in Illinois (Gatz and Prospero, 1996). In a past study, Saharan Dust over the East Coast was identified based on the Al: Ca ratio exceeding 3.8 and dust mass loadings exceeding 3 μg m−3 (Hegg et al., 1997; Perry et al., 1997). During a dust event in July 2001, Castanho et al. (2005) reported Al:Ca values of ~3.5 and PM10 up to 7 μg m−3. These high Al:Ca ratios are especially consistent with the African values in the southernmost sites (SWAN1, ROMA1, OKEF1, EVER1) with values ≥ 3.8. However, it should be noted that past work has reported on significant regional heterogeneity in northern African dust composition owing to diverse sediment types, which could especially impact Al:Ca ratios (Moreno et al., 2006; Scheuvens et al., 2013). In contrast to African dust, Al:Ca ratios of Asian dust were observed to be below 2.6 by VanCuren and Cahill (2002), which is consistent with the results of this study. Others have also noted that Asian dust exhibits lower Al:Ca ratios than African dust (Arimoto et al., 2006; Formenti et al., 2011; Zhang et al., 2003b), including values of 1.27 in Zhenbeitai, China (Alfaro et al., 2003), 0.53 for general Chinese desert regions (Zhang et al., 1998), and values between 1.39 and 2.44 as observed during the ACE-Asia campaign in parts of East Asia and the Northwest Pacific region (Arimoto et al., 2006).
Similar to the Al:Ca ratio, Fe:Ca ratios were highest in the African (2.04 ± 0.19) and Mix (2.16 ± 0.45) categories. Also, there was a gradient of high to low values for the African category from south to north along the East Coast. A fairly wide range has been reported for values of Fe:Ca in the literature, with the following reported values relevant to African Dust: 3.19 over Eastern U.S. (Perry et al., 1997), 1.36–2.76 in Illinois (Gatz and Prospero, 1996), 0.33–0.71 in Italy (Nava et al., 2012), and 0.9–2.71 at the Cape Verde Islands (Chiapello et al., 1997). Consistent with this work, values reported in the literature for Asian dust are lower than those for African dust (0.8–1.35) (Alfaro et al., 2003; Arimoto et al., 2006).
The ratio of K:Fe has been used in the past to distinguish between Asian and African dust (VanCuren and Cahill, 2002). More specifically, they reported that K:Fe typically exceeds 0.5 for Asian dust unlike African dust, which exhibited values below that owing in part to the influence of K from biomass burning. Values between 0.48 and 0.60 were reported by others for Asian dust (Alfaro et al., 2003; Arimoto et al., 2006). In this study, the K:Fe ratio for Asian dust (1.09 ± 0.29) also exceeded that of African dust (0.61 ± 0.31). This ratio did not exhibit very clear latitudinal gradients for any category, potentially due to the influence of regional sources for potassium such as with biomass burning. To support this last point, the Other category exhibited the highest overall K:Fe ratios (2.08 ± 1.85) with notably high values at EVER1 (7.15).
Other studies have used some combination of values associated with PM10 (e.g., >40 μg m−3, >100 μg m−3), PM2.5:PM10 ratios (e.g., <0.20, <0.35), concentrations of crustal elements, and enrichment factors of anthropogenic elements to distinguish local dust sources from non-local dust sources (Ganor et al., 2009; Tong et al., 2012). While sources represented by the Other category are in closer in proximity to the East Coast as compared to Asian and African sources, they still may not be in very close proximity to major dust sources that can yield such high PM10 levels that could exceed thresholds of 40 μg m−3 and 100 μg m−3. The mean value of PM10 in all categories for all sites always exceeded 10 μg m−3, with the highest being for the African category (26.02 ± 5.27 μg m−3) and the maximum expectedly being at EVER1 (34.49 μg m−3). The lowest mean PM10 levels were for the Other category (20.71 ± 7.65 μg m−3). The lowest PM10 value regardless of source category was usually at ACAD1 to the far north. The NEYO1 site exhibited the highest mean PM10 levels in the Other category (39.40 μg m−3) owing at least partly to anthropogenic emissions of dust, which is why that site was also enhanced in the African (31.96 μg m−3) and Asian (36.52 μg m−3) categories too. The minimum and maximum PM10 values for individual sites varied widely depending on the source with the lowest minimum being 3.98 μg m−3 (African dust at SWAN1) and the highest maximum being 126.84 μg m−3 (Other dust at BRIG1).
The mean ratios of PM2.5:PM10 ranged between 0.52 ± 0.15 (Mix) and 0.63 ± 0.05 (Other), with Asian (0.56 ± 0.10) and African (0.59 ± 0.11) having intermediate values. The Other category exhibited the least variability between sites potentially because transport distances and trajectories were not as variable coming from Africa or Asia. The PM2.5:PM10 ratios tended to increase from the south to the north for the Africa dust category, consistent with the more likely retention of the smallest dust particles during transport. The EVER1 site tended to exhibit among the lowest value for most source categories owing with the exception of the Mix category for which MAV1 exhibited an unusually low ratio value of 0.21. Although not the focus of this study, it is very likely that coarse sea spray particles impacted these ratios to varying degrees for the different sites as they contribute appreciably to PM10 at coastal sites.
3.4.2. Speciated mass concentrations
A comparison of the mass concentrations of different PM2.5 constituents for the dust events examined in this work can provide insight into the level of pollution coincident with dust plumes from different sources. For instance, Asian deserts are near major polluted areas and thus dust emanating from such sources can be enriched with anthropogenic species such as sulfates and nitrates (Fan et al., 1996; Formenti et al., 2011; Okada and Kai, 2004; Zhang et al., 2003a; Zhou et al., 1996). Measurements over New England showed that even North American pollution has been able to enrich Asian dust with anthropogenic pollutants (DeBell et al., 2004). Similarly, African dust can potentially interact with western African and eastern Mediterranean sources of pollution, thereby contaminating transported dust with constituents such as sulfate and nitrate (Falkovich et al., 2001; Kocak et al., 2007; Putaud et al., 2004). Even North American dust emissions undergo changes as a result of mixing with anthropogenic sources to become enriched with various contaminants such as lead, arsenic, copper, and zinc (e.g., Prabhakar et al., 2014). The addition of pollutants to dust aerosol as a result of aging processes is significant with regard to altering hygroscopic and optical properties. It is cautioned that the results discussed here and summarized in Table 7 are likely influenced also by regional pollution at each of the studied sites, which is especially pronounced for the more urban areas such as NEYO1.
Table 7.
Average concentrations (μg m−3) of different PM2.5 constituents for each source category. The blank cell indicates no available data for that category.
| ACAD1 | 0.92 | 0.73 | 0.48 | 0.76 | Nitrate | ACAD1 | 0.22 | 0.61 | 0.63 | 0.39 |
| CABA1 | 1.69 | 0.93 | 0.56 | 1.31 | CABA1 | 0.53 | 0.59 | 0.86 | 0.31 | |
| CACO1 | 2.49 | 0.89 | 0.65 | 1.62 | CACO1 | 0.44 | 0.79 | 0.99 | 0.54 | |
| MAVI1 | 2.91 | 0.90 | 0.67 | 2.77 | MAVI1 | 0.71 | 1.15 | 1.33 | 0.71 | |
| NEYO1 | 2.44 | 2.32 | 1.82 | NEYO1 | 0.70 | 3.36 | 3.70 | |||
| BRIG1 | 2.23 | 1.35 | 0.68 | 1.85 | BRIG1 | 0.43 | 1.17 | 3.21 | 0.42 | |
| SWAN1 | 3.65 | 1.71 | 0.66 | 2.28 | SWAN1 | 0.36 | 0.57 | 0.80 | 0.43 | |
| ROMA1 | 5.58 | 1.33 | 0.89 | 6.00 | ROMA1 | 0.42 | 0.52 | 0.52 | 0.33 | |
| OKEF1 | 7.22 | 1.70 | 1.73 | 5.11 | OKEF1 | 0.36 | 0.48 | 0.34 | 0.41 | |
| EVER1 | 10.27 | 2.69 | 0.86 | 4.39 | EVER1 | 0.45 | 0.48 | 0.48 | 0.48 | |
| ACAD1 | 2.48 | 1.40 | 1.53 | 1.31 | Sulfate | ACAD1 | 7.20 | 2.77 | 3.39 | 1.96 |
| CABA1 | 2.51 | 1.93 | 2.32 | 0.99 | CABA1 | 8.20 | 3.07 | 3.13 | 1.26 | |
| CACO1 | 1.12 | 1.76 | 1.84 | 1.42 | CACO1 | 2.99 | 4.23 | 3.86 | 4.24 | |
| MAVI1 | 2.17 | 1.61 | 1.70 | 0.77 | MAVI1 | 5.49 | 4.63 | 3.75 | 1.88 | |
| NEYO1 | 2.82 | 4.09 | 4.10 | NEYO1 | 7.87 | 5.15 | 7.16 | |||
| BRIG1 | 2.69 | 2.08 | 2.67 | 0.98 | BRIG1 | 5.26 | 5.04 | 3.97 | 3.39 | |
| SWAN1 | 0.95 | 1.96 | 2.42 | 1.13 | SWAN1 | 2.25 | 4.03 | 3.46 | 1.43 | |
| ROMA1 | 1.13 | 2.47 | 2.85 | 1.20 | ROMA1 | 2.37 | 3.76 | 3.51 | 1.56 | |
| OKEF1 | 1.49 | 3.01 | 2.86 | 1.28 | OKEF1 | 1.81 | 2.97 | 2.41 | 1.60 | |
| EVER1 | 0.68 | 1.05 | 1.66 | 0.68 | EVER1 | 2.01 | 1.99 | 2.64 | 2.22 | |
| ACAD1 | 0.46 | 0.32 | 0.39 | 0.22 | Potassium | ACAD1 | 0.05 | 0.05 | 0.05 | 0.04 |
| CABA1 | 0.60 | 0.45 | 0.64 | 0.11 | CABA1 | 0.08 | 0.06 | 0.07 | 0.04 | |
| CACO1 | 0.11 | 0.34 | 0.48 | 0.17 | CACO1 | 0.07 | 0.06 | 0.06 | 0.06 | |
| MAVI1 | 0.23 | 0.34 | 0.45 | 0.04 | MAVI1 | 0.10 | 0.07 | 0.08 | 0.09 | |
| NEYO1 | 1.65 | 2.38 | 3.07 | NEYO1 | 0.07 | 0.10 | 0.08 | |||
| BRIG1 | 0.36 | 0.48 | 0.80 | 0.20 | BRIG1 | 0.08 | 0.07 | 0.08 | 0.06 | |
| SWAN1 | 0.05 | 0.35 | 0.54 | 0.07 | SWAN1 | 0.11 | 0.09 | 0.07 | 0.08 | |
| ROMA1 | 0.09 | 0.45 | 0.63 | 0.16 | ROMA1 | 0.13 | 0.10 | 0.10 | 0.12 | |
| OKEF1 | 0.08 | 0.52 | 0.44 | 0.10 | OKEF1 | 0.16 | 0.10 | 0.10 | 0.12 | |
| EVER1 | 0.04 | 0.27 | 0.44 | 0.09 | EVER1 | 0.22 | 0.10 | 0.23 | 0.13 |
The largest difference for any species examined between Asian and African dust across the East Coast was for nitrate. More specifically, nitrate exhibited its highest mean concentration across the East Coast for the Other category (1.29 ± 1.18 μg m−3), followed by Asian dust (0.97 ± 0.88 μg m−3), and then African (0.46 ± 0.15 μg m−3) and Mix (0.45 ± 0.12 μg m−3). Owing to high urban background influence, the NEYO1 site exhibited relatively higher values of all constituents in Table 7, especially nitrate (3.36 μg m−3). Sulfate levels also exhibited a fair amount of variability between source categories with the highest levels for African dust (4.54 ± 2.56 μg m−3) and the lowest for Mix (2.17 ± 1.00 μg m−3). In terms of the other species examined, organic carbon (OC) and elemental carbon (EC) both peaked in the Other category (2.39 ± 0.78 μg m−3 and 0.79 ± 0.81 μg m−3, respectively), whereas potassium was almost the same at each site on average (0.08–0.11 μg m−3). There were varying spatial patterns for the species examined for the different sources, with often no clear trend at all. Potassium was unique in that it always was most enhanced at the southernmost sites, with the cause being unknown based on this dataset.
4. Conclusions
This work utilized a variety of datasets to characterize the nature of significant dust events across ten sites along the U.S. East coast between 2004 and 2017. Significant dust events were categorized into four major dust sources: African, Asian, Mix (Asian + African), and Other (anything besides African and Asian dust). The main results were as follows:
Relationships were observed between the major sources of dust and latitude of the ten sites, where African dust events were more frequent from North Carolina to the south and Asian dust events were more influential from New Jersey to the north. Other and Mix events did not show a clear latitudinal trend. Fine soil levels were generally highest during African dust events as compared to any other category for the entire East Coast, with a gradient from high to low levels from Florida to Maine.
The summer months (JJA) were mainly influenced by African dust for sites between Florida and New Jersey, while MAM is heavily impacted by Asian dust for all sites. Mix events were most common between April and October. A higher frequency of Other events were observed outside of MAM and JJA seasons, linked in part to some combination of anthropogenic activities and biomass burning.
Seven out of ten sites had Other as the most common source of dust events. These events categorized as Other revealed higher average concentrations of organic carbon (OC) and elemental carbon (EC) than other dust source categories, suggestive of regional anthropogenic emissions.
The ratios Si:Al, K:Fe, Fe:Ca, and Al:Ca varied between sites and dust source as would be expected based on reports of varying chemical signatures from different sources. Additionally, those elemental ratios and PM2.5:PM10 exhibited relationships with respect to latitude for African dust where values decreased progressively from south to north corresponding to the expected trajectory of dust transport. Such a latitudinal trend was not evident for dust events stemming from the other three source categories.
Future work is warranted to continue investigating the nature of dust aerosol over the U.S. East Coast. More specifically, measurements should improve characterization of the vertical profile of dust and the changing role of dust constituents in altering the radiative and hygroscopic properties of PM2.5 in light of reductions in other constituents such as sulfate from regulatory activities (Hand et al., 2012a). Also, analysis of longer datasets is warranted to gain insights into whether robust long-term trends exist for dust concentrations, the relative importance of different dust source regions, and the composition of the dust events from different sources.
Supplementary Material
HIGHLIGHTS.
Significant dust events were categorized as Asian, African, Mix, and Other.
Relationships between major dust sources and latitude were observed.
Each dust source was dominant in distinct season(s).
Seven out of ten sites had Other as the most common dust source.
Asian and African dust events exhibited different PM2.5 composition.
Acknowledgements
This work was funded by NASA grant 80NSSC19K0442 in support of the ACTIVATE Earth Venture Suborbital-3 (EVS-3) investigation, which is funded by NASA’s Earth Science Division and managed through the Earth System Science Pathfinder Program Office. We acknowledge the use of data and imagery from LANCE FIRMS operated by NASA’s Earth Science Data and Information System (ESDIS) with funding provided by NASA Headquarters.
Footnotes
Declaration of competing interest
The authors declare that they have no known competing financial interests or personal relationships that could have appeared to influence the work reported in this paper.
Appendix A. Supplementary data
Supplementary data to this article can be found online at https://doi.org/10.1016/j.atmosenv.2020.117456.
References
- Alastuey A, Querol X, Aas W, Lucarelli F, Pérez N, Moreno T, Cavalli F, Areskoug H, Balan V, Catrambone M, Ceburnis D, Cerro JC, Conil S, Gevorgyan L, Hueglin C, Imre K, Jaffrezo JL, Leeson SR, Mihalopoulos N, Mitosinkova M, O’Dowd CD, Pey J, Putaud JP, Riffault V, Ripoll A, Sciare J, Sellegri K, Spindler G, Yttri KE, 2016. Geochemistry of PM10 over Europe during the EMEP intensive measurement periods in summer 2012 and winter 2013. Atmos. Chem. Phys 16, 6107–6129. [Google Scholar]
- Alfaro SC, Gomes L, Rajot JL, Lafon S, Gaudichet A, Chatenet B, Maille M, Cautenet G, Lasserre F, Cachier H, Zhang XY, 2003. Chemical and optical characterization of aerosols measured in spring 2002 at the ACE-Asia supersite, Zhenbeitai, China. J. Geophys. Res. Atmos 108. [Google Scholar]
- Arimoto R, Duce RA, Ray BJ, Ellis WG, Cullen JD, Merrill JT, 1995. Trace-elements in the atmosphere over the north-Atlantic. J. Geophys. Res. Atmos 100, 1199–1213. [Google Scholar]
- Arimoto R, Duce RA, Savoie DL, Prospero JM, 1992. Trace-elements in aerosol-particles from Bermuda and Barbados - concentrations, sources and relationships to aerosol sulfate. J. Atmos. Chem 14, 439–457. [Google Scholar]
- Arimoto R, Kim YJ, Kim YP, Quinn PK, Bates TS, Anderson TL, Gong S, Uno I, Chin M, Huebert BJ, Clarke AD, Shinozuka Y, Weber RJ, Anderson JR, Guazzotti SA, Sullivan RC, Sodeman DA, Prather KA, Sokolik IN, 2006. Characterization of Asian dust during ACE-Asia. Global Planet. Change 52, 23–56. [Google Scholar]
- Baddock MC, Gill TE, Bullard JE, Acosta MD, Rivera NIR, 2011. Geomorphology of the Chihuahuan Desert based on potential dust emissions. J. Maps 7, 249–259. [Google Scholar]
- Blanco A, De Tomasi F, Filippo E, Manno D, Perrone MR, Serra A, Tafuro AM, Tepore A, 2003. Characterization of African dust over southern Italy. Atmos. Chem. Phys 3, 2147–2159. [Google Scholar]
- Bosilovich MG, Lucchesi R, Suarez M, 2016. MERRA-2: File Specification.
- Bozlaker A, Prospero JM, Fraser MP, Chellam S, 2013. Quantifying the contribution of long-range Saharan dust transport on particulate matter concentrations in Houston, Texas, using detailed elemental analysis. Environ. Sci. Technol 47, 10179–10187. [DOI] [PubMed] [Google Scholar]
- Bozlaker A, Prospero JM, Price J, Chellam S, 2019. Identifying and quantifying the impacts of Advected North African dust on the concentration and composition of airborne fine particulate matter in Houston and Galveston, Texas. J. Geophys. Res.: Atmosphere 124, 12282–12300. [Google Scholar]
- Cahill TA, Ashbaugh LL, Eldred RA, Feeney PJ, Kusko BH, Flocchini RG, 1981. Comparisons between size-segregated resuspended soil samples and ambient aerosols in the western United States, Atmospheric Aerosol: source/Air Quality Relationships Am. Chem. Soc. Symp. Ser (Washington, D.C: ). [Google Scholar]
- Carlson TN, Prospero JM, 1972. The large-Scale movement of Saharan air outbreaks over the northern equatorial Atlantic. J. Appl. Meteorol 11, 283–297. [Google Scholar]
- Castanho ADD, Martins JV, Hobbs PV, Artaxo P, Remer L, Yamasoe M, Colarco PR, 2005. Chemical characterization of aerosols on the east coast of the United States using aircraft and ground-based stations during the CLAMS experiment. J. Atmos. Sci 62, 934–946. [Google Scholar]
- Chen SP, Lu CH, McQueen J, Lee P, 2018. Application of satellite observations in conjunction with aerosol reanalysis tor to characterize long-range transport of African and Asian dust on air quality in the contiguous US. Atmos. Environ 187, 174–195. [Google Scholar]
- Chiapello I, Bergametti G, Chatenet B, Bousquet P, Dulac F, Soares ES, 1997. Origins of African dust transported over the northeastern tropical Atlantic. J. Geophys. Res. Atmos 102, 13701–13709. [Google Scholar]
- Chow JC, Lowenthal DH, Chen LWA, Wang XL, Watson JG, 2015. Mass reconstruction methods for PM2.5: a review. Air Qual. Atmos. Health 8, 243–263. [DOI] [PMC free article] [PubMed] [Google Scholar]
- Cottle P, Strawbridge K, McKendry I, O’Neill N, Saha A, 2013. A pervasive and persistent Asian dust event over North America during spring 2010: lidar and sunphotometer observations. Atmos. Chem. Phys 13, 4515–4527. [Google Scholar]
- Creamean JM, Suski KJ, Rosenfeld D, Cazorla A, DeMott PJ, Sullivan RC, White AB, Ralph FM, Minnis P, Comstock JM, Tomlinson JM, Prather KA, 2013. Dust and biological aerosols from the Sahara and Asia influence precipitation in the western. U.S. Sci 339, 1572–1578. [DOI] [PubMed] [Google Scholar]
- Crosbie E, Sorooshian A, Monfared NA, Shingler T, Esmaili O, 2014. A multi-year aerosol characterization for the greater tehran area using satellite, surface, and modeling data. Atmosphere-Basel 5, 178–197. [DOI] [PMC free article] [PubMed] [Google Scholar]
- Dadashazar H, Ma L, Sorooshian A, 2019. Sources of pollution and interrelationships between aerosol and precipitation chemistry at a central California site. Sci. Total Environ 651, 1776–1787. [DOI] [PMC free article] [PubMed] [Google Scholar]
- DeBell LJ, Vozzella M, Talbot RW, Dibb JE, 2004. Asian dust storm events of spring 2001 and associated pollutants observed in New England by the Atmospheric Investigation, Regional Modeling, Analysis and Prediction (AIRMAP) monitoring network. J. Geophys. Res. Atmos 109. [Google Scholar]
- Dockery DW, Pope CA, Xu XP, Spengler JD, Ware JH, Fay ME, Ferris BG, Speizer FE, 1993. An association between air-pollution and mortality in 6 United-States Cities. N. Engl. J. Med 329, 1753–1759. [DOI] [PubMed] [Google Scholar]
- Duce RA, Unni CK, Ray BJ, Prospero JM, Merrill JT, 1980. Long-range atmospheric transport of soil dust from Asia to the tropical north Pacific - temporal variability. Science 209, 1522–1524. [DOI] [PubMed] [Google Scholar]
- Falkovich AH, Ganor E, Levin Z, Formenti P, Rudich Y, 2001. Chemical and mineralogical analysis of individual mineral dust particles. J. Geophys. Res. Atmos 106, 18029–18036. [Google Scholar]
- Fan XB, Okada K, Niimura N, Kai K, Arao K, Shi GY, Qin Y, Mitsuta Y, 1996. Mineral particles collected in China and Japan during the same Asian dust-storm event. Atmos. Environ 30, 347–351. [Google Scholar]
- Formenti P, Elbert W, Maenhaut W, Haywood J, Andreae MO, 2003. Chemical composition of mineral dust aerosol during the Saharan Dust Experiment (SHADE) airborne campaign in the Cape Verde region, September 2000. J. Geophys. Res. Atmos 108. [Google Scholar]
- Formenti P, Schutz L, Balkanski Y, Desboeufs K, Ebert M, Kandler K, Petzold A, Scheuvens D, Weinbruch S, Zhang D, 2011. Recent progress in understanding physical and chemical properties of African and Asian mineral dust. Atmos. Chem. Phys 11, 8231–8256. [Google Scholar]
- Ganor E, Stupp A, Alpert P, 2009. A method to determine the effect of mineral dust aerosols on air quality. Atmos. Environ 43, 5463–5468. [Google Scholar]
- Gatz DF, Prospero JM, 1996. A large silicon-aluminum aerosol plume in central Illinois: north African desert dust? Atmos. Environ 30, 3789–3799. [Google Scholar]
- Gelaro R, McCarty W, Suarez MJ, Todling R, Molod A, Takacs L, Randles CA, Darmenov A, Bosilovich MG, Reichle R, Wargan K, Coy L, Cullather R, Draper C, Akella S, Buchard V, Conaty A, da Silva AM, Gu W, Kim GK, Koster R, Lucchesi R, Merkova D, Nielsen JE, Partyka G, Pawson S, Putman W, Rienecker M, Schubert SD, Sienkiewicz M, Zhao B, 2017. The modern-era retrospective analysis for research and Applications, version 2 (MERRA-2). J. Clim 30, 5419–5454. [DOI] [PMC free article] [PubMed] [Google Scholar]
- Ginoux P, Prospero JM, Gill TE, Hsu NC, Zhao M, 2012. Global-scale Attribution of anthropogenic and natural dust sources and their emission rates based on Modis deep blue aerosol products. Rev. Geophys 50. [Google Scholar]
- Gkikas A, Hatzianastassiou N, Mihalopoulos N, 2009. Aerosol events in the broader Mediterranean basin based on 7-year (2000–2007) MODIS C005 data. Ann. Geophys. Germany 27, 3509–3522. [Google Scholar]
- Guo JP, Lou MY, Miao YC, Wang Y, Zeng ZL, Liu H, He J, Xu H, Wang F, Min M, Zhai PM, 2017. Trans-Pacific transport of dust aerosols from East Asia: insights gained from multiple observations and modeling. Environ. Pollut 230, 1030–1039. [DOI] [PubMed] [Google Scholar]
- Hand JL, Gill TE, Schichtel BA, 2017. Spatial and seasonal variability in fine mineral dust and coarse aerosol mass at remote sites across the United States. J. Geophys. Res.: Atmosphere 122, 3080–3097. [Google Scholar]
- Hand JL, Schichtel BA, Malm WC, Pitchford ML, 2012a. Particulate sulfate ion concentration and SO2 emission trends in the United States from the early 1990s through 2010. Atmos. Chem. Phys 12, 10353–10365. [Google Scholar]
- Hand JL, Schichtel BA, Pitchford M, Malm WC, Frank NH, 2012b. Seasonal composition of remote and urban fine particulate matter in the United States. J. Geophys. Res.: Atmosphere 117. [Google Scholar]
- Hand JL, White WH, Gebhart KA, Hyslop NP, Gill TE, Schichtel BA, 2016. Earlier onset of the spring fine dust season in the southwestern United States. Geophys. Res. Lett 43, 4001–4009. [Google Scholar]
- Hegg DA, Livingston J, Hobbs PV, Novakov T, Russell P, 1997. Chemical apportionment of aerosol column optical depth off the mid-Atlantic coast of the United States. J. Geophys. Res. Atmos 102, 25293–25303. [Google Scholar]
- Hogan TF, Liu M, Ridout JA, Peng MS, Whitcomb TR, Ruston BC, Reynolds CA, Eckermann SD, Moskaitis JR, Baker NL, McCormack JP, Viner KC, Mclay JG, Flatau MK, Xu L, Chen C, Chang SW, 2014. The Navy global environmental model. Oceanography 27, 116–125. [Google Scholar]
- Holzer M, McKendry IG, Jaffe DA, 2003. Springtime trans-Pacific atmospheric transport from east Asia: a transit-time probability density function approach. J. Geophys. Res. Atmos 108. [Google Scholar]
- Husar RB, Tratt DM, Schichtel BA, Falke SR, Li F, Jaffe D, Gasso S, Gill T, Laulainen NS, Lu F, Reheis MC, Chun Y, Westphal D, Holben BN, Gueymard C, McKendry I, Kuring N, Feldman GC, McClain C, Frouin RJ, Merrill J, DuBois D, Vignola F, Murayama T, Nickovic S, Wilson WE, Sassen K, Sugimoto N, Malm WC, 2001. Asian dust events of April 1998. J. Geophys. Res. Atmos 106, 18317–18330. [Google Scholar]
- Jaffe D, Snow J, Cooper O, 2003. The 2001 Asian dust events: transport and impact on surface aerosol concentrations in the U.S. EOS. Trans. Am. Geophys. Union 84, 501–507. [Google Scholar]
- Kandler K, Benker N, Bundke U, Cuevas E, Ebert M, Knippertz P, Rodriguez S, Schutz L, Weinbruch S, 2007. Chemical composition and complex refractive index of Saharan Mineral Dust at Izana, Tenerife (Spain) derived by electron microscopy. Atmos. Environ 41, 8058–8074. [Google Scholar]
- Kavouras IG, Etyemezian V, DuBois DW, Xu J, Pitchford M, 2009. Source reconciliation of atmospheric dust causing visibility impairment in Class I areas of the western United States. J. Geophys. Res. Atmos 114. [Google Scholar]
- Kocak M, Mihalopoulos N, Kubilay N, 2007. Chemical composition of the fine and coarse fraction of aerosols in the northeastern Mediterranean. Atmos. Environ 41, 7351–7368. [Google Scholar]
- Lopez DH, Rabbani MR, Crosbie E, Raman A, Arellano AF, Sorooshian A, 2016. Frequency and character of extreme aerosol events in the southwestern United States: a case study analysis in Arizona. Atmosphere-Basel 7. [DOI] [PMC free article] [PubMed] [Google Scholar]
- Lynch P, Reid JS, Westphal DL, Zhang JL, Hogan TF, Hyer EJ, Curtis CA, Hegg DA, Shi YX, Campbell JR, Rubin JI, Sessions WR, Turk FJ, Walker AL, 2016. An 11-year global gridded aerosol optical thickness reanalysis (v1.0) for atmospheric and climate sciences. Geosci. Model Dev. (GMD) 9, 1489–1522. [Google Scholar]
- Malm WC, 1992. Characteristics and origins of Haze in the continental United-States. Earth Sci. Rev 33, 1–36. [Google Scholar]
- Malm WC, Schichtel BA, Pitchford ML, Ashbaugh LL, Eldred RA, 2004. Spatial and monthly trends in speciated fine particle concentration in the United States. J. Geophys. Res. Atmos 109. [Google Scholar]
- Malm WC, Sisler JF, 2000. Spatial patterns of major aerosol species and selected heavy metals in the United States. Fuel Process. Technol 65, 473–501. [Google Scholar]
- Malm WC, Sisler JF, Huffman D, Eldred RA, Cahill TA, 1994. Spatial and seasonal trends in particle concentration and optical extinction in the United-States. J. Geophys. Res. Atmos 99, 1347–1370. [Google Scholar]
- Marenco F, Bonasoni P, Calzolari F, Ceriani M, Chiari M, Cristofanelli P, D’Alessandro A, Fermo P, Lucarelli F, Mazzei F, Nava S, Piazzalunga A, Prati P, Valli G, Vecchi R, 2006. Characterization of atmospheric aerosols at Monte Cimone, Italy, during summer 2004: source apportionment and transport mechanisms. J. Geophys. Res. Atmos 111. [Google Scholar]
- McKendry IG, Strawbridge KB, O’Neill NT, Macdonald AM, Liu PSK, Leaitch WR, Anlauf KG, Jaegle L, Fairlie TD, Westphal DL, 2007. Trans-Pacific transport of Saharan dust to western North America: a case study. J. Geophys. Res. Atmos 112. [Google Scholar]
- Moreno T, Querol X, Castillo S, Alastuey A, Cuevas E, Herrmann L, Mounkaila M, Elvira J, Gibbons W, 2006. Geochemical variations in aeolian mineral particles from the Sahara-Sahel dust corridor. Chemosphere 65, 261–270. [DOI] [PubMed] [Google Scholar]
- Nava S, Becagli S, Calzolai G, Chiari M, Lucarelli F, Prati P, Traversi R, Udisti R, Valli G, Vecchi R, 2012. Saharan dust impact in central Italy: an overview on three years elemental data records. Atmos. Environ 60, 444–452. [Google Scholar]
- Okada K, Kai K, 2004. Atmospheric mineral particles collected at Qira in the Taklamakan desert, China. Atmos. Environ 38, 6927–6935. [Google Scholar]
- Perry KD, Cahill TA, Eldred RA, Dutcher DD, Gill TE, 1997. Long-range transport of North African dust to the eastern United States. J. Geophys. Res. Atmos 102, 11225–11238. [Google Scholar]
- Pitchford M, Flocchini RG, Draftz RG, Cahill TA, Ashbaugh LL, Eldred RA, 1981. Silicon in submicron particles in the southwest. Atmos. Environ 15, 321–333, 1967. [Google Scholar]
- Prabhakar G, Sorooshian A, Toffol E, Arellano AF, Betterton EA, 2014. Spatiotemporal distribution of airborne particulate metals and metalloids in a populated arid region. Atmos. Environ 92, 339–347. [DOI] [PMC free article] [PubMed] [Google Scholar]
- Prospero JM, 1999a. Long-range transport of mineral dust in the global atmosphere: impact of African dust on the environment of the southeastern United States. Proc. Natl. Acad. Sci. U.S.A 96, 3396–3403. [DOI] [PMC free article] [PubMed] [Google Scholar]
- Prospero JM, 1999b. Long-term measurements of the transport of African mineral dust to the southeastern United States: implications for regional air quality. J. Geophys. Res. Atmos 104, 15917–15927. [Google Scholar]
- Prospero JM, Landing W, 2009. African Dust Deposition to Florida: how well do dust models perform? Iop C Ser. Earth Environ 7. [Google Scholar]
- Putaud JP, Van Dingenen R, Dell’Acqua A, Raes F, Matta E, Decesari S, Facchini MC, Fuzzi S, 2004. Size-segregated aerosol mass closure and chemical composition in Monte Cimone (I) during MINATROC. Atmos. Chem. Phys 4, 889–902. [Google Scholar]
- Reid EA, Reid JS, Meier MM, Dunlap MR, Cliff SS, Broumas A, Perry K, Maring H, 2003. Characterization of African dust transported to Puerto Rico by individual particle and size segregated bulk analysis. J. Geophys. Res. Atmos 108. [Google Scholar]
- Reid JS, Koppmann R, Eck TF, Eleuterio DP, 2005. A review of biomass burning emissions part II: intensive physical properties of biomass burning particles. Atmos. Chem. Phys 5, 799–825. [Google Scholar]
- Rivera NIR, Gill TE, Bleiweiss MP, Hand JL, 2010. Source characteristics of hazardous Chihuahuan Desert dust outbreaks. Atmos. Environ 44, 2457–2468. [Google Scholar]
- Rogers HM, Ditto JC, Gentner DR, 2020. Evidence for impacts on surface-level air quality in the northeastern US from long-distance transport of smoke from North American fires during the Long Island Sound Tropospheric Ozone Study (LISTOS) 2018. Atmos. Chem. Phys 20, 671–682. [Google Scholar]
- Rolph GD, 2016. Real-time Environmental Applications and Display System (Ready).
- Savoie DL, Prospero JM, 1977. Aerosol concentration statistics for northern tropical Atlantic. J. Geophys. Res. Oc Atmos 82, 5954–5964. [Google Scholar]
- Scheuvens D, Schütz L, Kandler K, Ebert M, Weinbruch S, 2013. Bulk composition of northern African dust and its source sediments — a compilation. Earth Sci. Rev 116, 170–194. [Google Scholar]
- Schlosser JS, Braun RA, Bradley T, Dadashazar H, MacDonald AB, Aldhaif AA, Aghdam MA, Mardi AH, Xian P, Sorooshian A, 2017. Analysis of aerosol composition data for western United States wildfires between 2005 and 2015: dust emissions, chloride depletion, and most enhanced aerosol constituents. J. Geophys. Res. Atmos 122, 8951–8966. [DOI] [PMC free article] [PubMed] [Google Scholar]
- Seinfeld JH, Pandis SN, 2016. Atmospheric Chemistry and Physics, third ed. Wiley-Interscience, New York. [Google Scholar]
- Shelley RU, Morton PL, Landing WM, 2015. Elemental ratios and enrichment factors in aerosols from the US-GEOTRMES North Atlantic transects. Deep-Sea Res Pt Ii 116, 262–272. [Google Scholar]
- Solomon PA, Crumpler D, Flanagan JB, Jayanty RKM, Rickman EE, McDade CE, 2014. US national PM2.5 chemical speciation monitoring networks-CSN and IMPROVE: description of networks. J. Air Waste Manag 64, 1410–1438. [DOI] [PubMed] [Google Scholar]
- Sorooshian A, Corral AF, Braun RA, Cairns B, Crosbie E, Ferrare R, Hair J, Kleb MM, Mardi AH, Maring H, McComiskey A, Moore R, Painemal D, Scarino AJ, Schlosser J, Shingler T, Shook M, Wang H, Zeng X, Ziemba L, Zuidema P, 2020. Atmospheric research over the western north Atlantic ocean region and North American East coast - Part 1: a review of past work and challenges Ahead. J. Geophys. Res. Atmos 125 (6) 10.1029/2019JD031626. [DOI] [PMC free article] [PubMed] [Google Scholar]
- Sorooshian A, Wonaschutz A, Jarjour EG, Hashimoto BI, Schichtel BA, Betterton EA, 2011. An aerosol climatology for a rapidly growing arid region (southern Arizona): major aerosol species and remotely sensed aerosol properties. J. Geophys. Res. Atmos 116. [DOI] [PMC free article] [PubMed] [Google Scholar]
- Stein AF, Draxler RR, Rolph GD, Stunder BJB, Cohen MD, Ngan F, 2015. Noaa’s Hysplit atmospheric transport and dispersion modeling System. Bull. Am. Meteorol. Soc 96, 2059–2077. [Google Scholar]
- Tong DQ, Dan M, Wang T, Lee P, 2012. Long-term dust climatology in the western United States reconstructed from routine aerosol ground monitoring. Atmos. Chem. Phys 12, 5189–5205. [Google Scholar]
- VanCuren RA, 2006. Asian aerosols in North America: extracting the chemical composition and mass concentration of the Asian continental aerosol plume from long-term aerosol records in the western United States (vol 108, pg 4623, 2003). J. Geophys. Res. Atmos 111. [Google Scholar]
- VanCuren RA, Cahill TA, 2002. Asian aerosols in North America: frequency and concentration of fine dust. J. Geophys. Res. Atmos 107. [Google Scholar]
- Wells KC, Witek M, Flatau P, Kreidenwei SM, Westphal DL, 2007. An analysis of seasonal surface dust aerosol concentrations in the western US (2001–2004): observations and model predictions. Atmos. Environ 41, 6585–6597. [Google Scholar]
- Wu YH, Han Z, Nazmi C, Gross B, Moshary F, 2015. A trans-Pacific Asian dust episode and its impacts to air quality in the east coast of US. Atmos. Environ 106, 358–368. [Google Scholar]
- Yu HB, Remer LA, Chin M, Bian HS, Tan Q, Yuan TL, Zhang Y, 2012. Aerosols from overseas rival domestic emissions over North America. Science 337, 566–569. [DOI] [PubMed] [Google Scholar]
- Zhang DZ, Iwasaka Y, Shi GY, Zang JY, Matsuki A, Trochkine D, 2003a. Mixture state and size of Asian dust particles collected at southwestern Japan in spring 2000. J. Geophys. Res. Atmos 108. [Google Scholar]
- Zhang XY, Arimoto R, Zhu GH, Chen T, Zhang GY, 1998. Concentration, size-distribution and deposition of mineral aerosol over Chinese desert regions. Tellus B 50, 317–330. [Google Scholar]
- Zhang XY, Gong SL, Shen ZX, Mei FM, Xi XX, Liu LC, Zhou ZJ, Wang D, Wang YQ, Cheng Y, 2003b. Characterization of soil dust aerosol in China and its transport and distribution during 2001 ACE-Asia: 1. Network observations. J. Geophys. Res.: Atmosphere 108. [Google Scholar]
- Zhang Y, Luo G, Yu F, 2019. Seasonal variations and long-term trend of dust particle number concentration over the Northeastern United States. J. Geophys. Res.: Atmosphere 124, 13140–13155. [Google Scholar]
- Zhao TL, Gong SL, Zhang XY, Blanchet JP, McKendry IG, Zhou ZJ, 2006. A simulated climatology of Asian dust aerosol and its trans-Pacific transport. Part I: mean climate and validation. J. Clim 19, 88–103. [Google Scholar]
- Zhou M, Okada K, Qian F, Wu PM, Su L, Casareto BE, Shimohara T, 1996. Characteristics of dust-storm particles and their long-range transport from China to Japan - case studies in April 1993. Atmos. Res 40, 19–31. [Google Scholar]
- Zuidema P, Alvarez C, Kramer SJ, Custals L, Izaguirre M, Sealy P, Prospero JM, Blades E, 2019. Is summer African dust arriving earlier to Barbados? The updated long-term in-situ dust mass concentration time series from Ragged Point, Barbados and Miami, Florida. Bull. Am. Meteorol. Soc 100, 1981–1986. [Google Scholar]
Associated Data
This section collects any data citations, data availability statements, or supplementary materials included in this article.