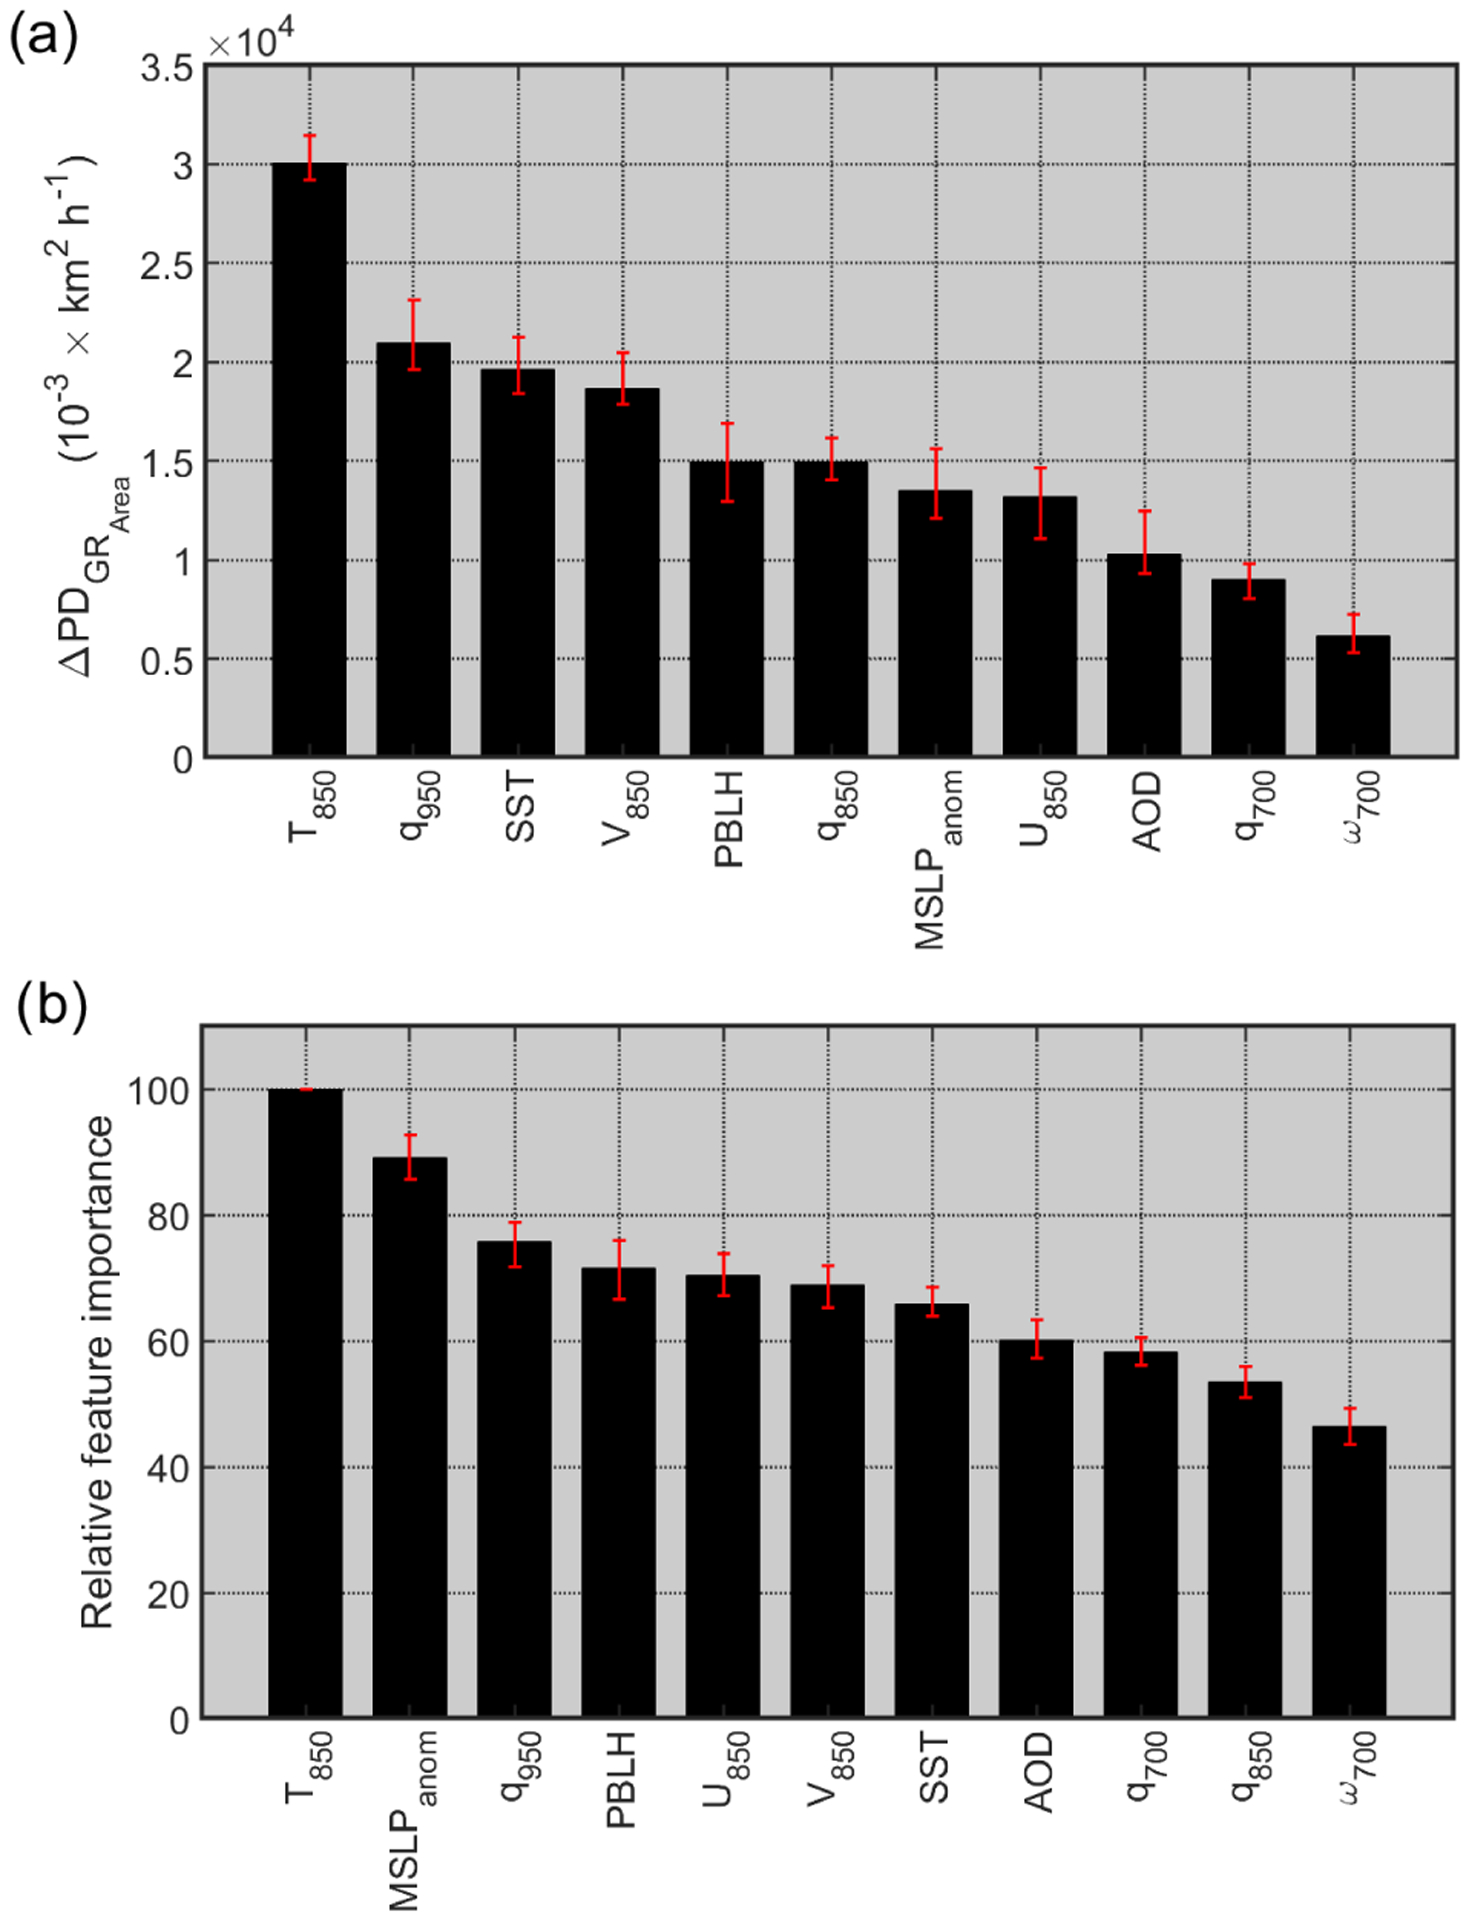
Figure 10.

Two scoring methods used for measuring the relative influence of input variables in the GBRT model: (a) the median difference of maximum and minimum partial dependence (PD) of clearing growth rate (GRArea) and (b) the median of relative feature importance calculated based on the method developed by Friedman (2001). Error bars represent the range of variability in 30 model runs. Note that GBRT simulations were performed using clearing growth rates obtained from the analysis of first and second GOES images (~ 09:00–12:00 PST) for all 306 clearing events examined.
