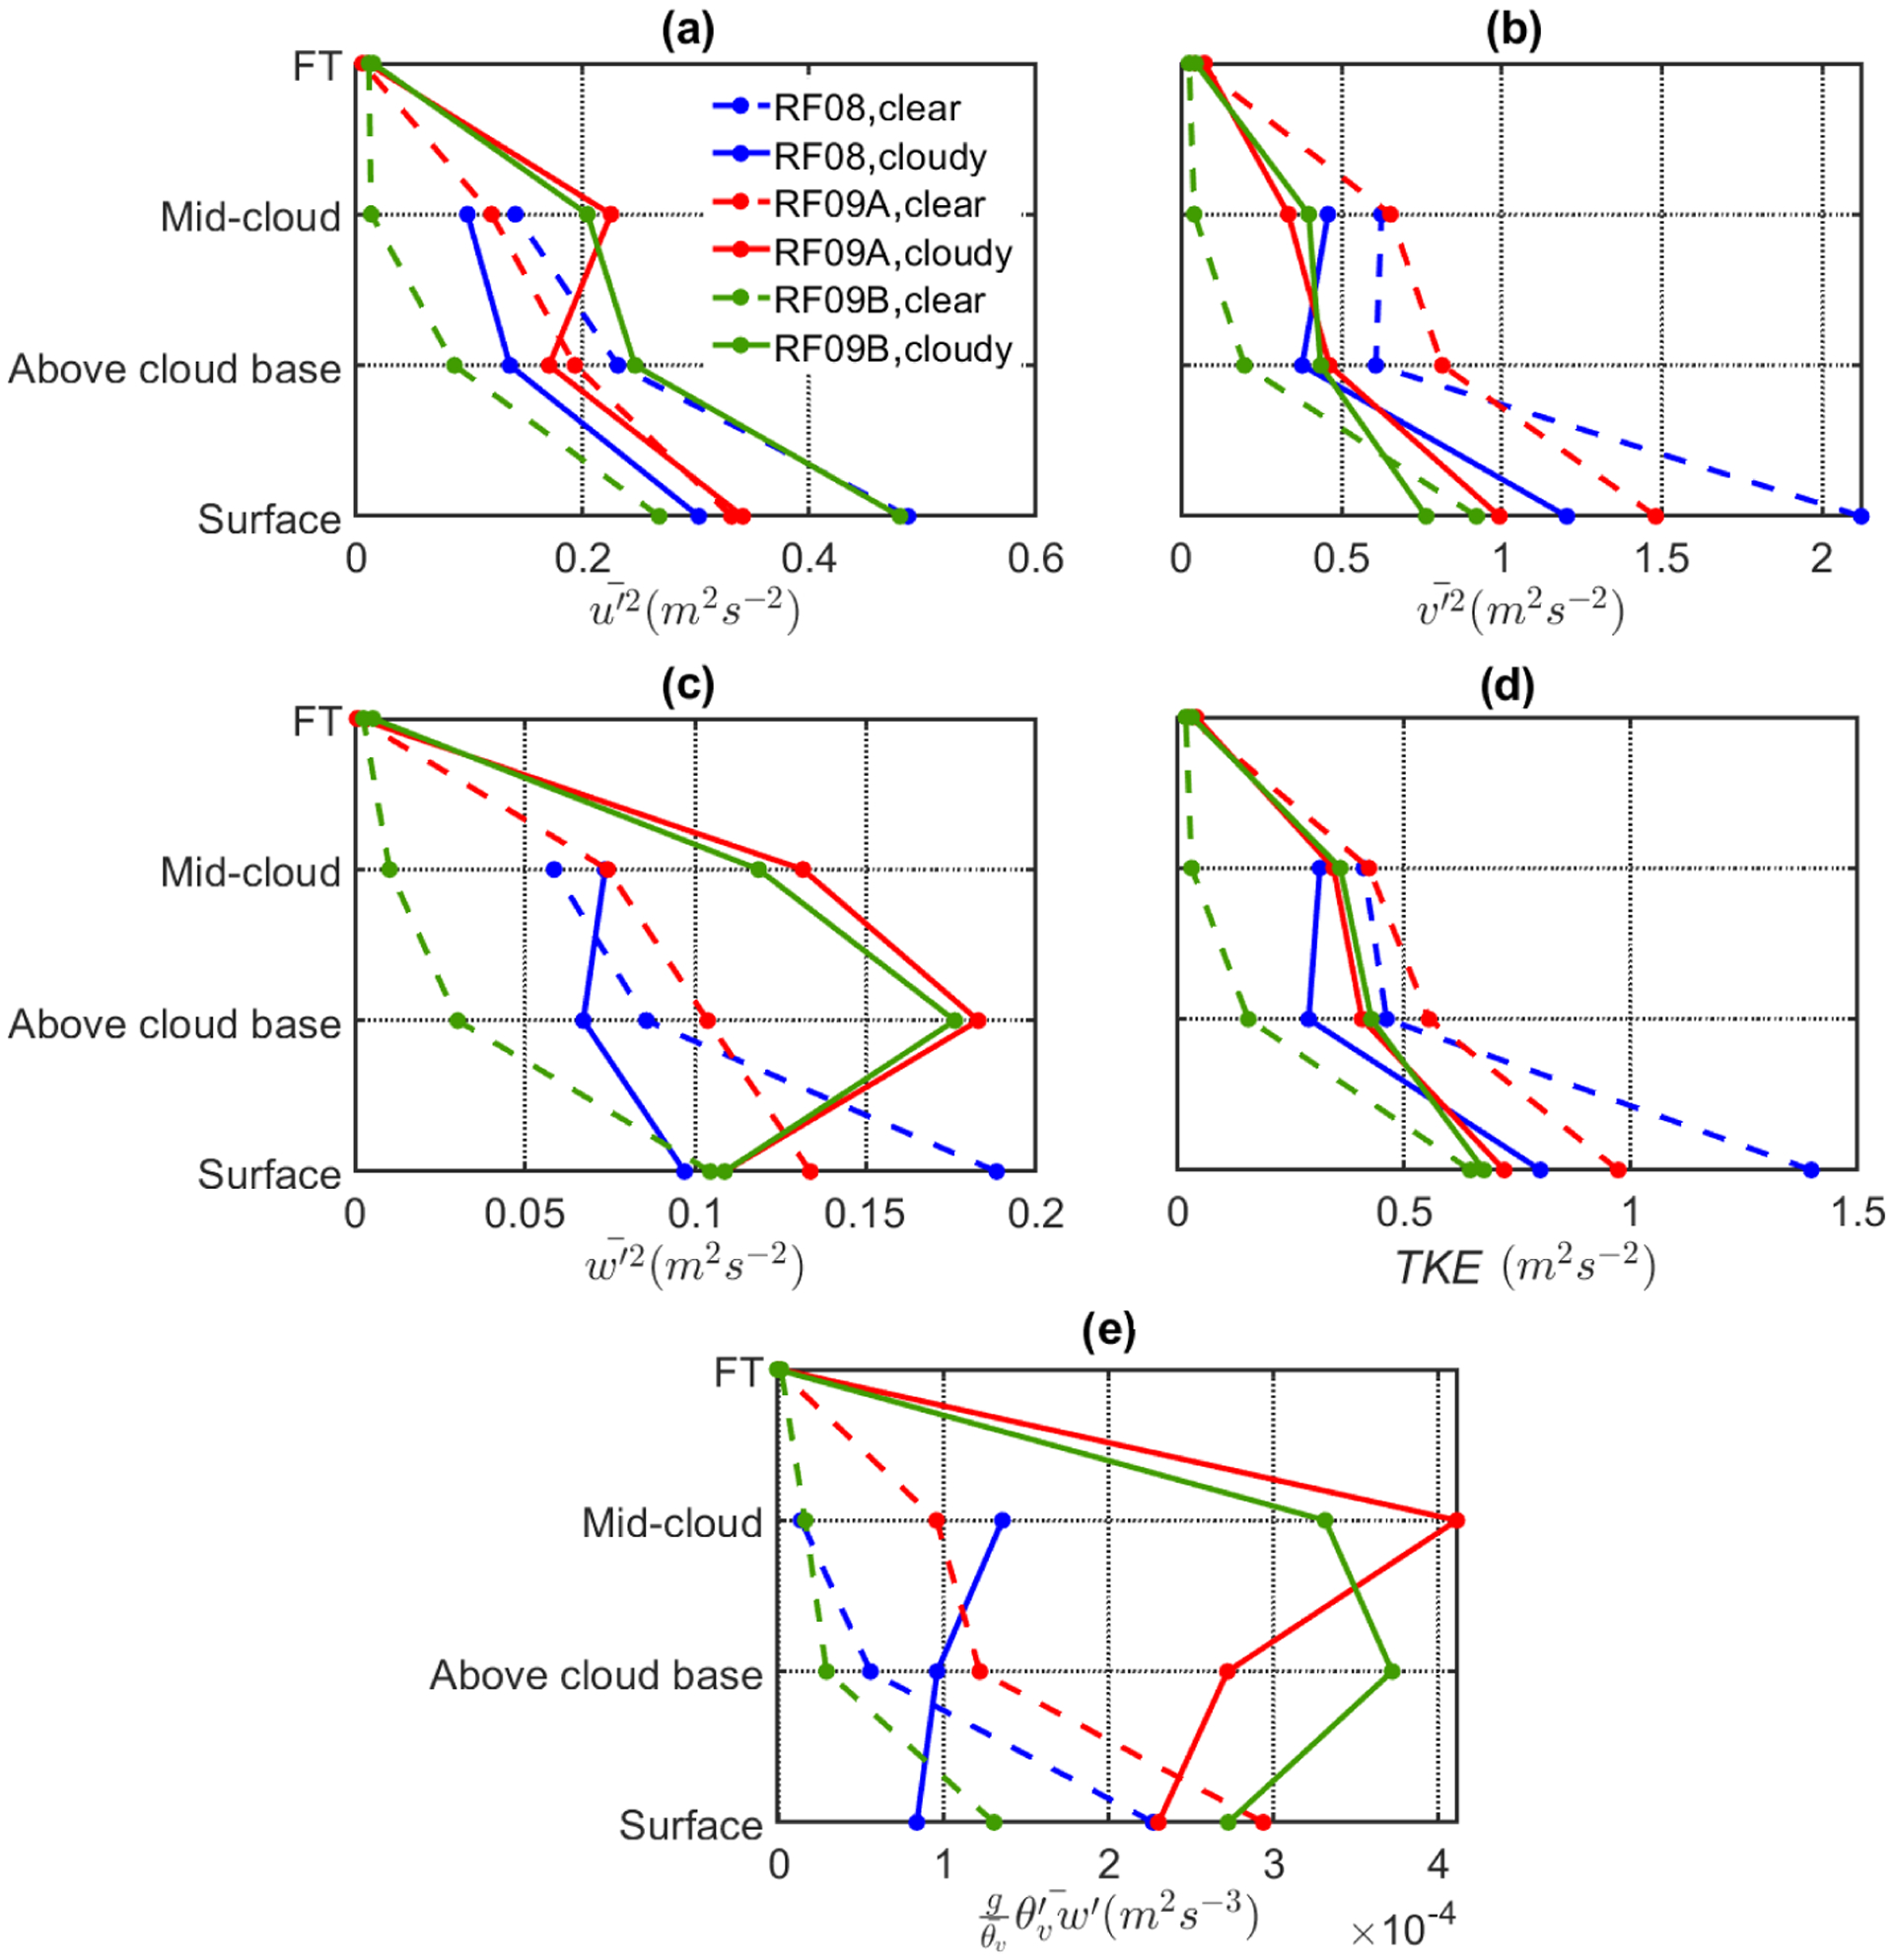
Figure 13.

Selected dynamic parameters for the clear (dashed lines) and cloudy (solid lines) parts of the legs performed at different altitudes for three FASE case research flights: panels (a)–(c) exhibit squared average velocity fluctuations of wind speeds components (u and v horizontal components, w vertical component). Horizontal wind speeds are decomposed into two components, (u) perpendicular and (v) parallel, relative to the cloud edge. Panels (d) and (e) display turbulent kinetic energy and buoyancy flux profiles, respectively, for the three flights.
