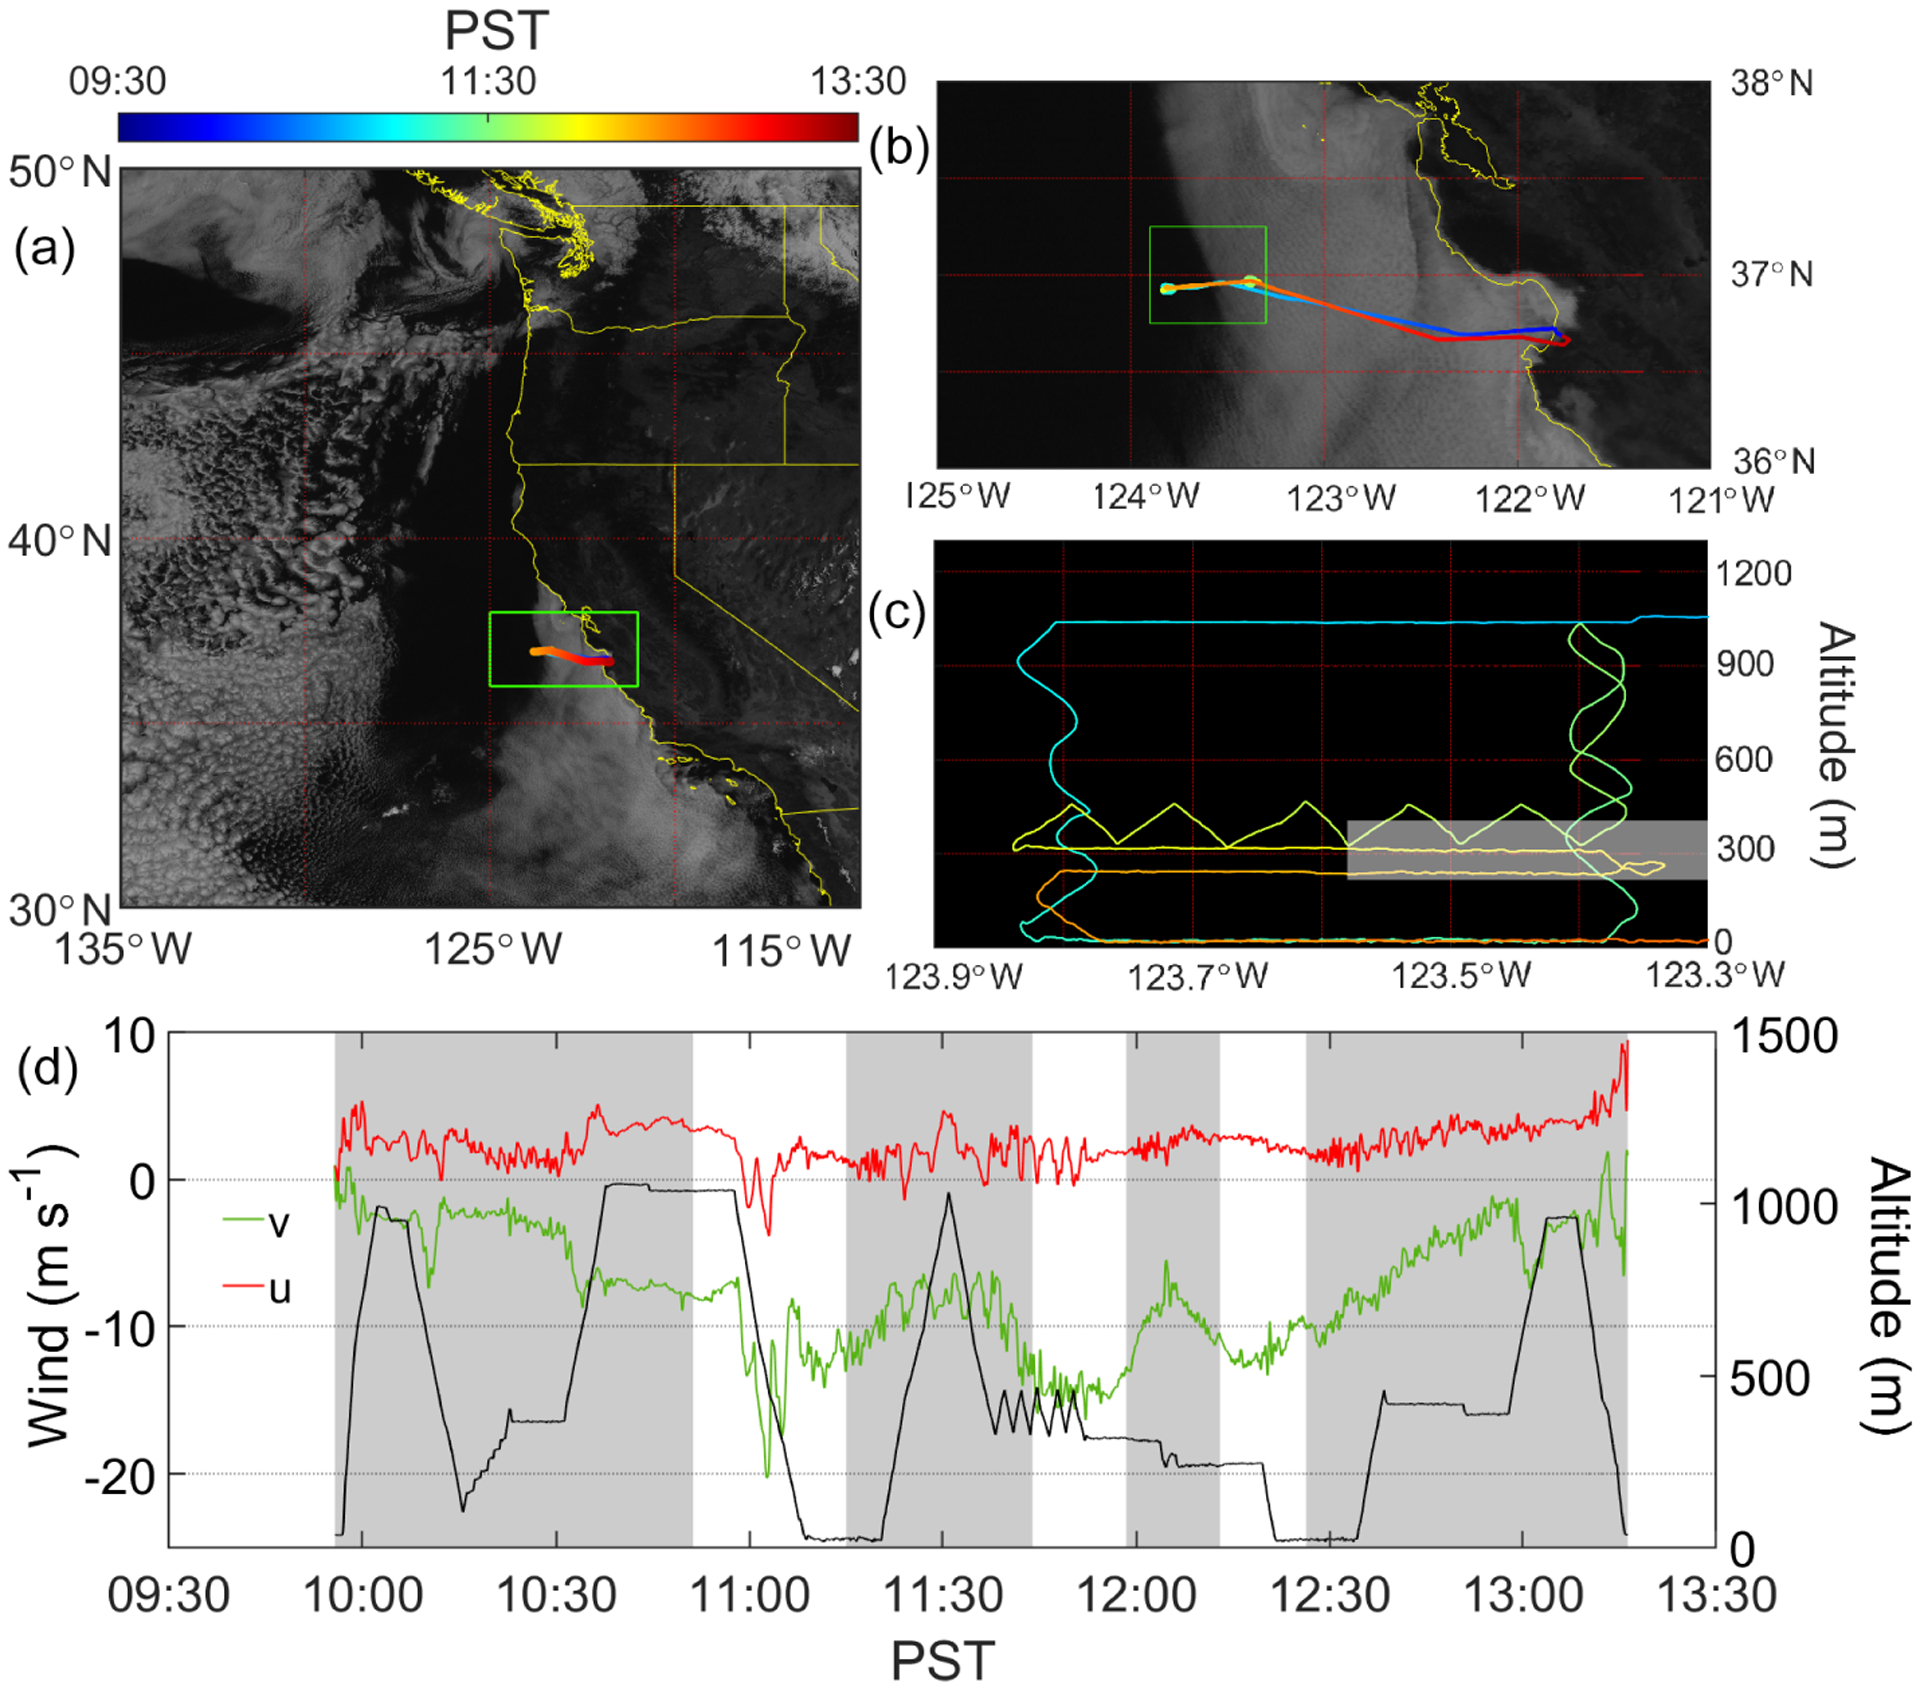
Figure 2.

(a) GOES-15 visible-band image (11:45 PST – 18:45 UTC – on 3 August 2016) with the overlaid flight path of FASE RF09A. (b) Zoomed-in view of the satellite image to highlight the clear–cloudy border. (c) Aircraft flight strategy at the clear–cloudy interface for the green box highlighted in (b). Cloud borders are denoted by a shaded box. (d) Time series of flight altitude and horizontal wind speed, which is decomposed into two components that are perpendicular (u) and parallel (v) to the cloud edge. Wind speeds were smoothed using low-pass filtering. Parts of the flight that sampled air on the cloudy side of the clear–cloudy border are shaded in grey.
