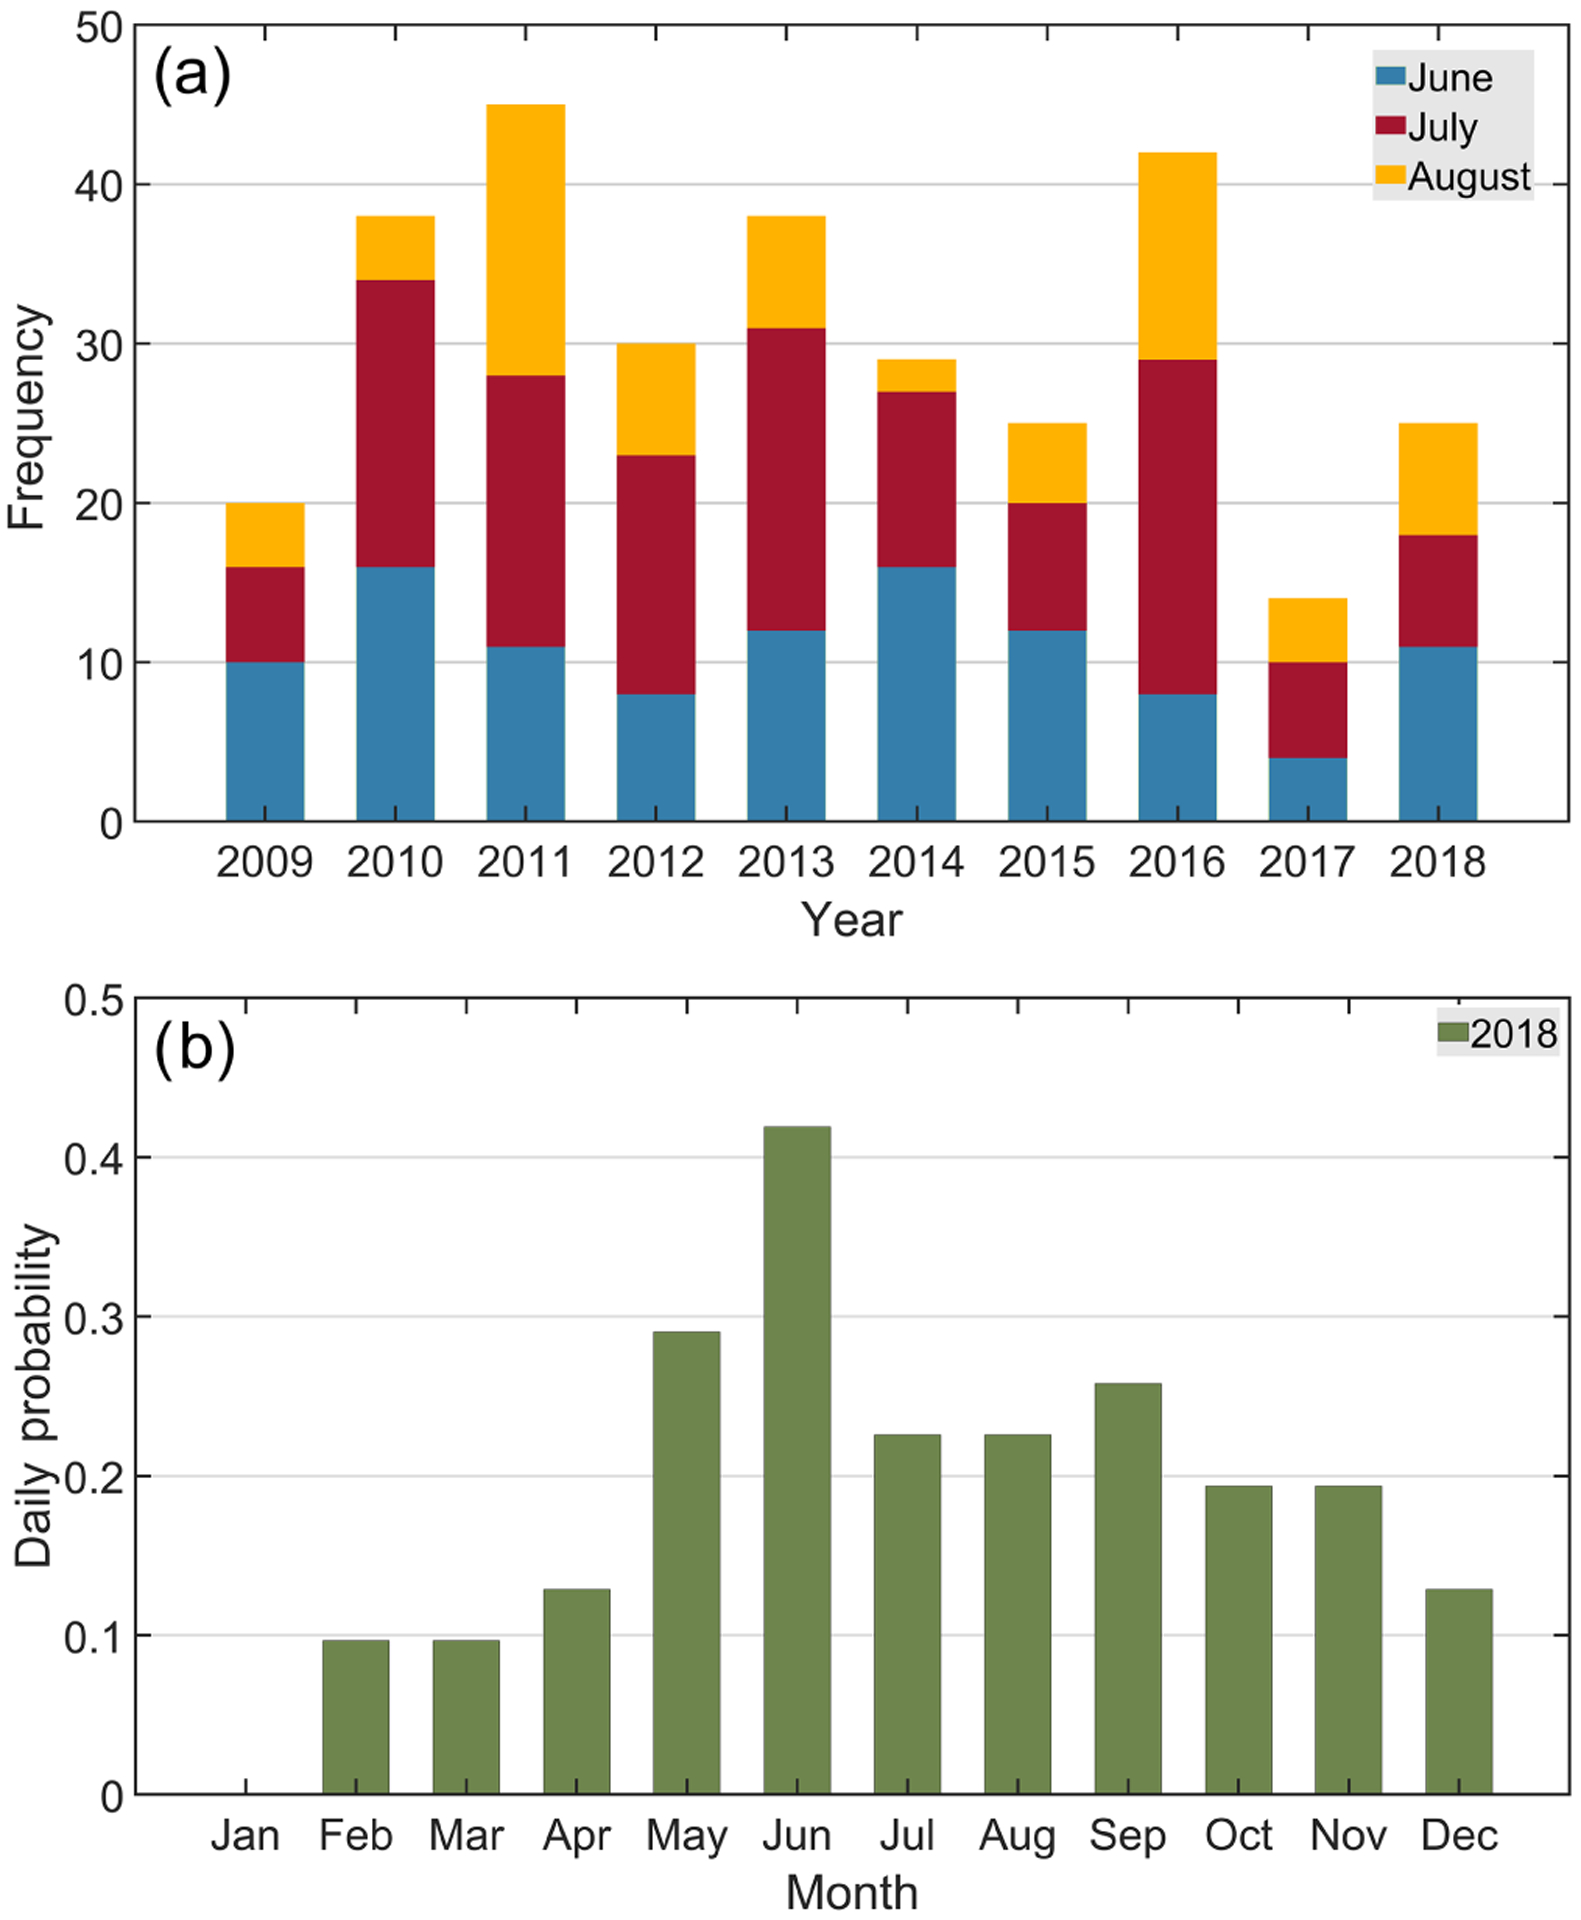
Figure 3.

(a) Frequency of clearing events in the study region for each summer month between 2009 and 2018. (b) Daily probability of clearing events (i.e., days with clearings divided by total days in that month) in each month of a representative year, 2018.
