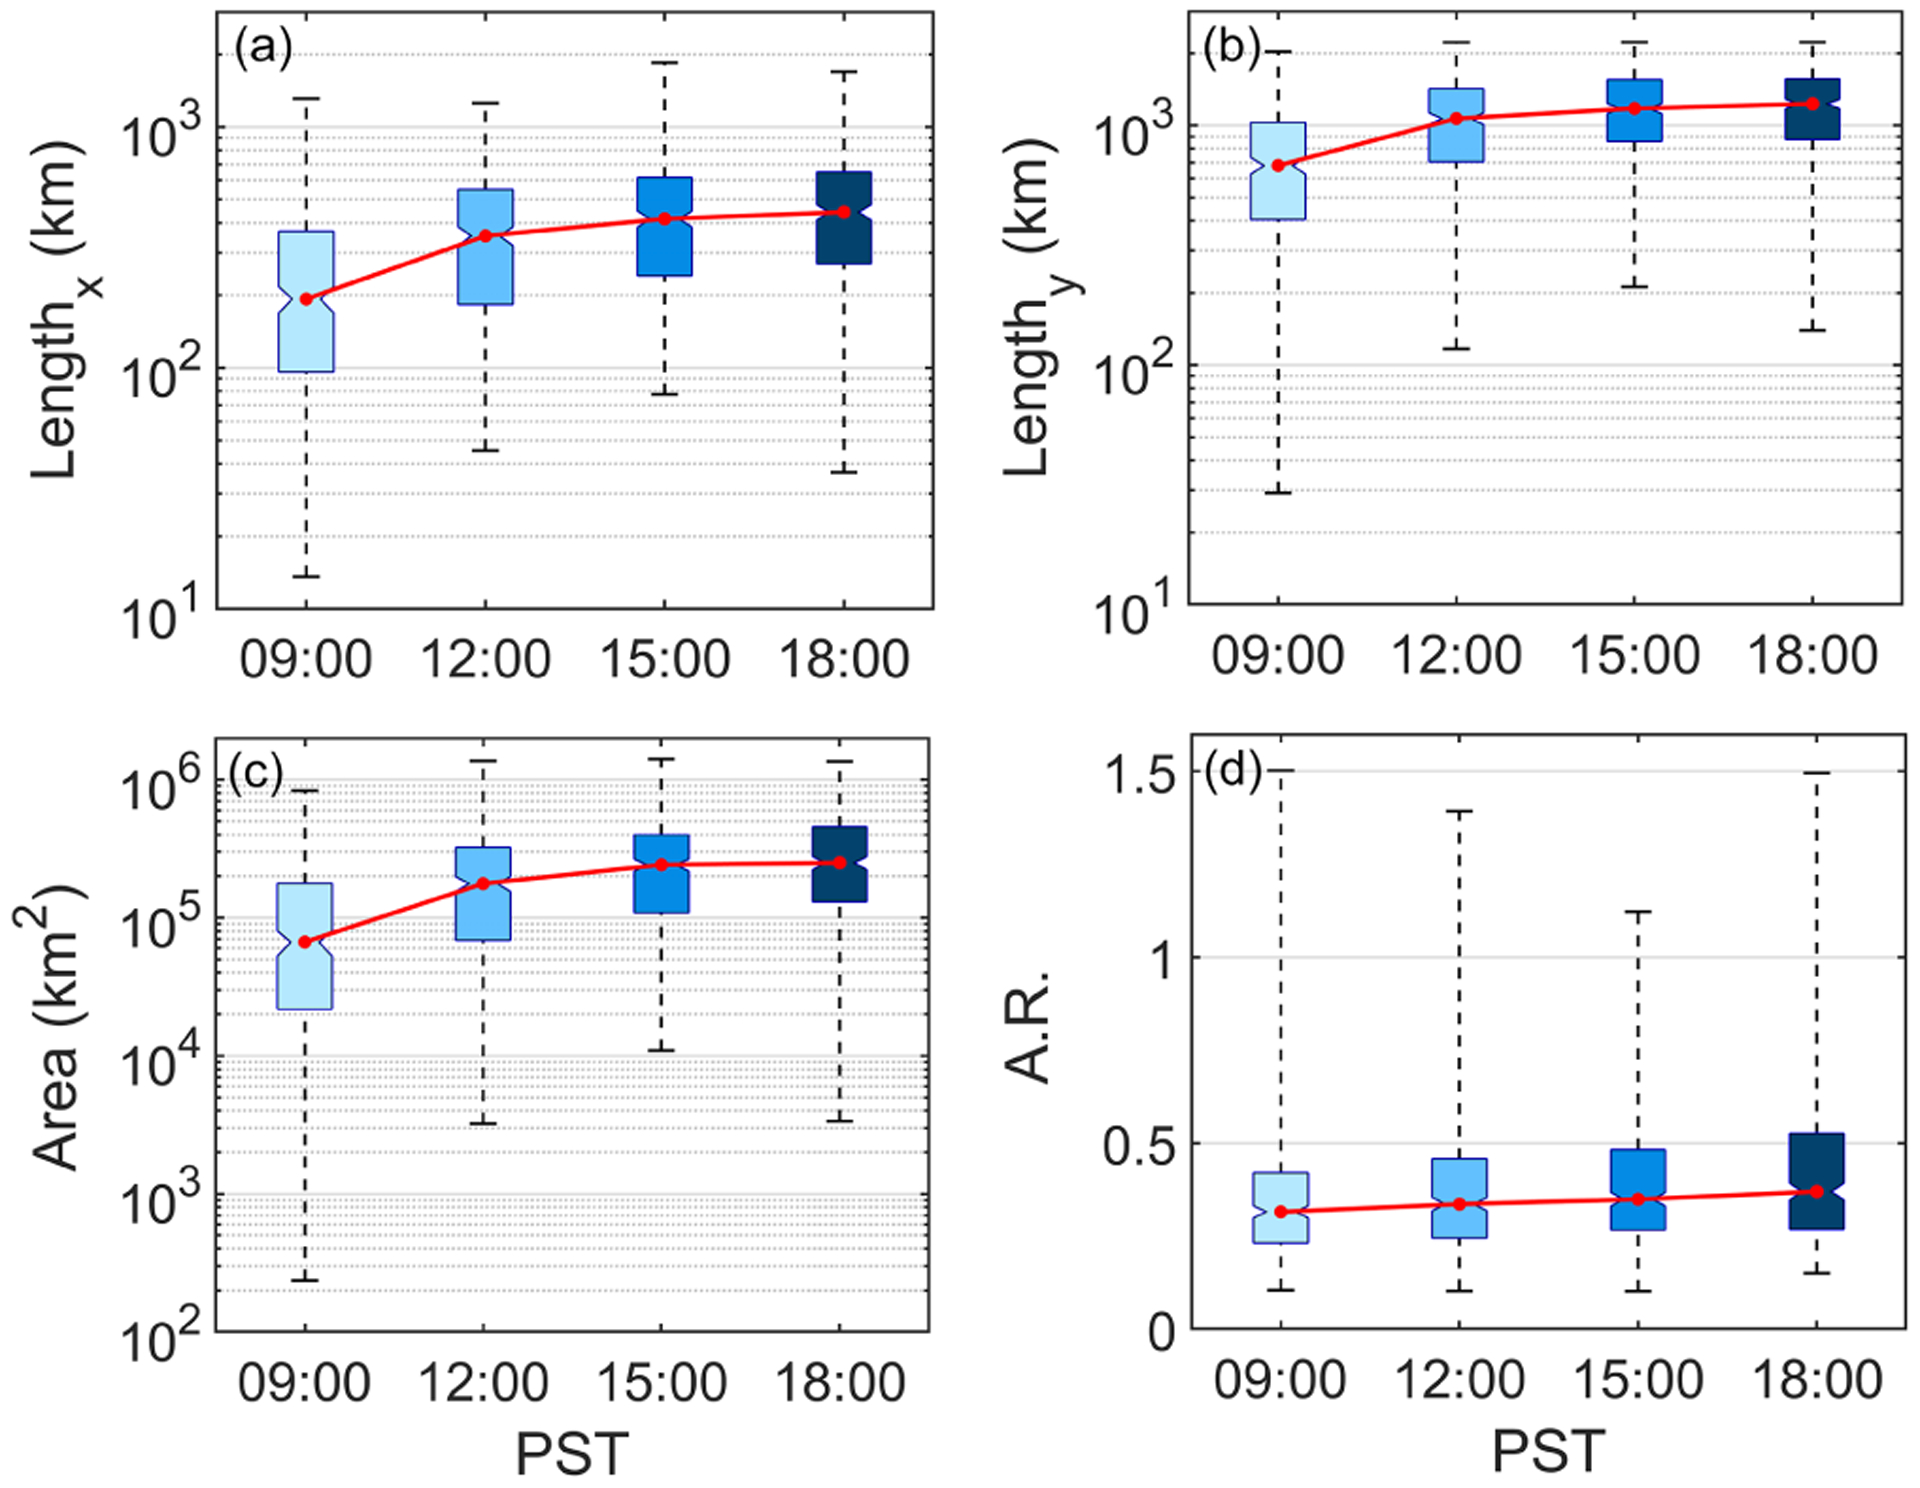
Figure 4.

Diurnal profiles of (a) widest point of clearings at a fixed latitudinal value, (b) longest dimension between the maximum and minimum latitudinal coordinates of a clearing regardless of longitudinal value, (c) total clearing area, and (d) aspect ratio (A.R.) of clearing (i.e., width divided by length using the maximum values as described by panels a–b). The box-and-whisker plots show the median values (red points), the 25th and 75th percentile values (bottom and top of boxes, respectively), and minimum and maximum values (bottom and top whiskers, respectively).
