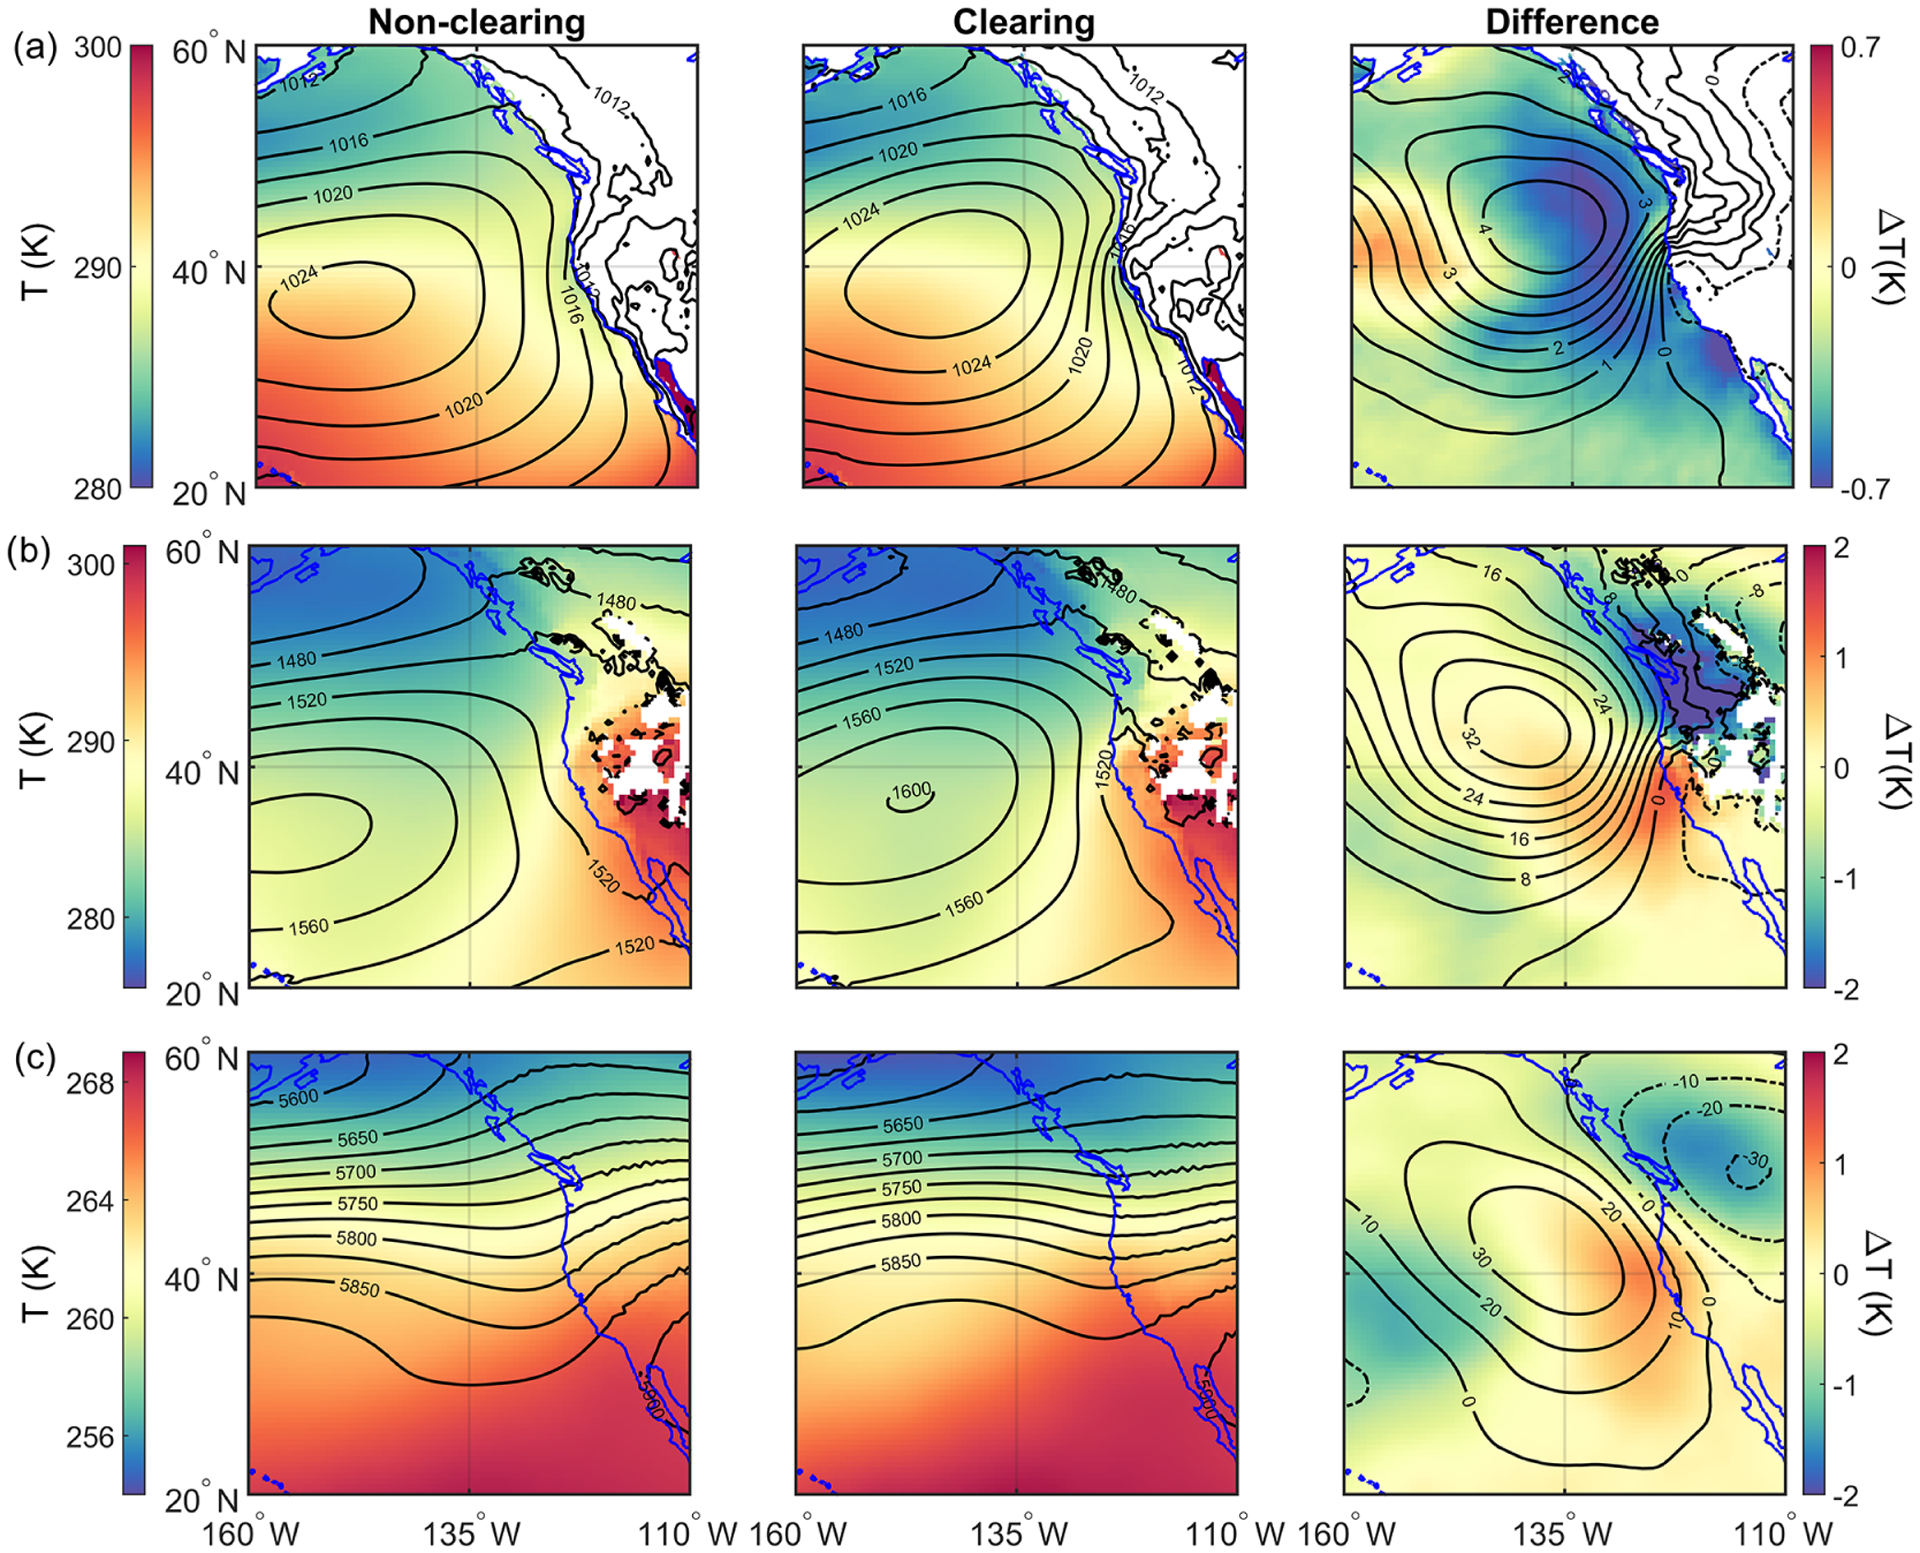
Figure 6.

Climatology of non-clearing and clearing days as well as their differences (clearing minus non-clearing) during the summers (JJA) between 2009 and 2018 for (a) mean sea level pressure (contours in hPa) and air temperature (color map) at sea surface, (b) 850 hPa geopotential heights (contours in m) and air temperature (color map), and (c) 500 hPa geopotential heights (contours in m) and air temperature (color map). The data were obtained from MERRA-2 reanalysis. Differences (clearing minus non-clearing) are shown in the farthest-right column with separate color scales. White areas indicate where no data were available.
