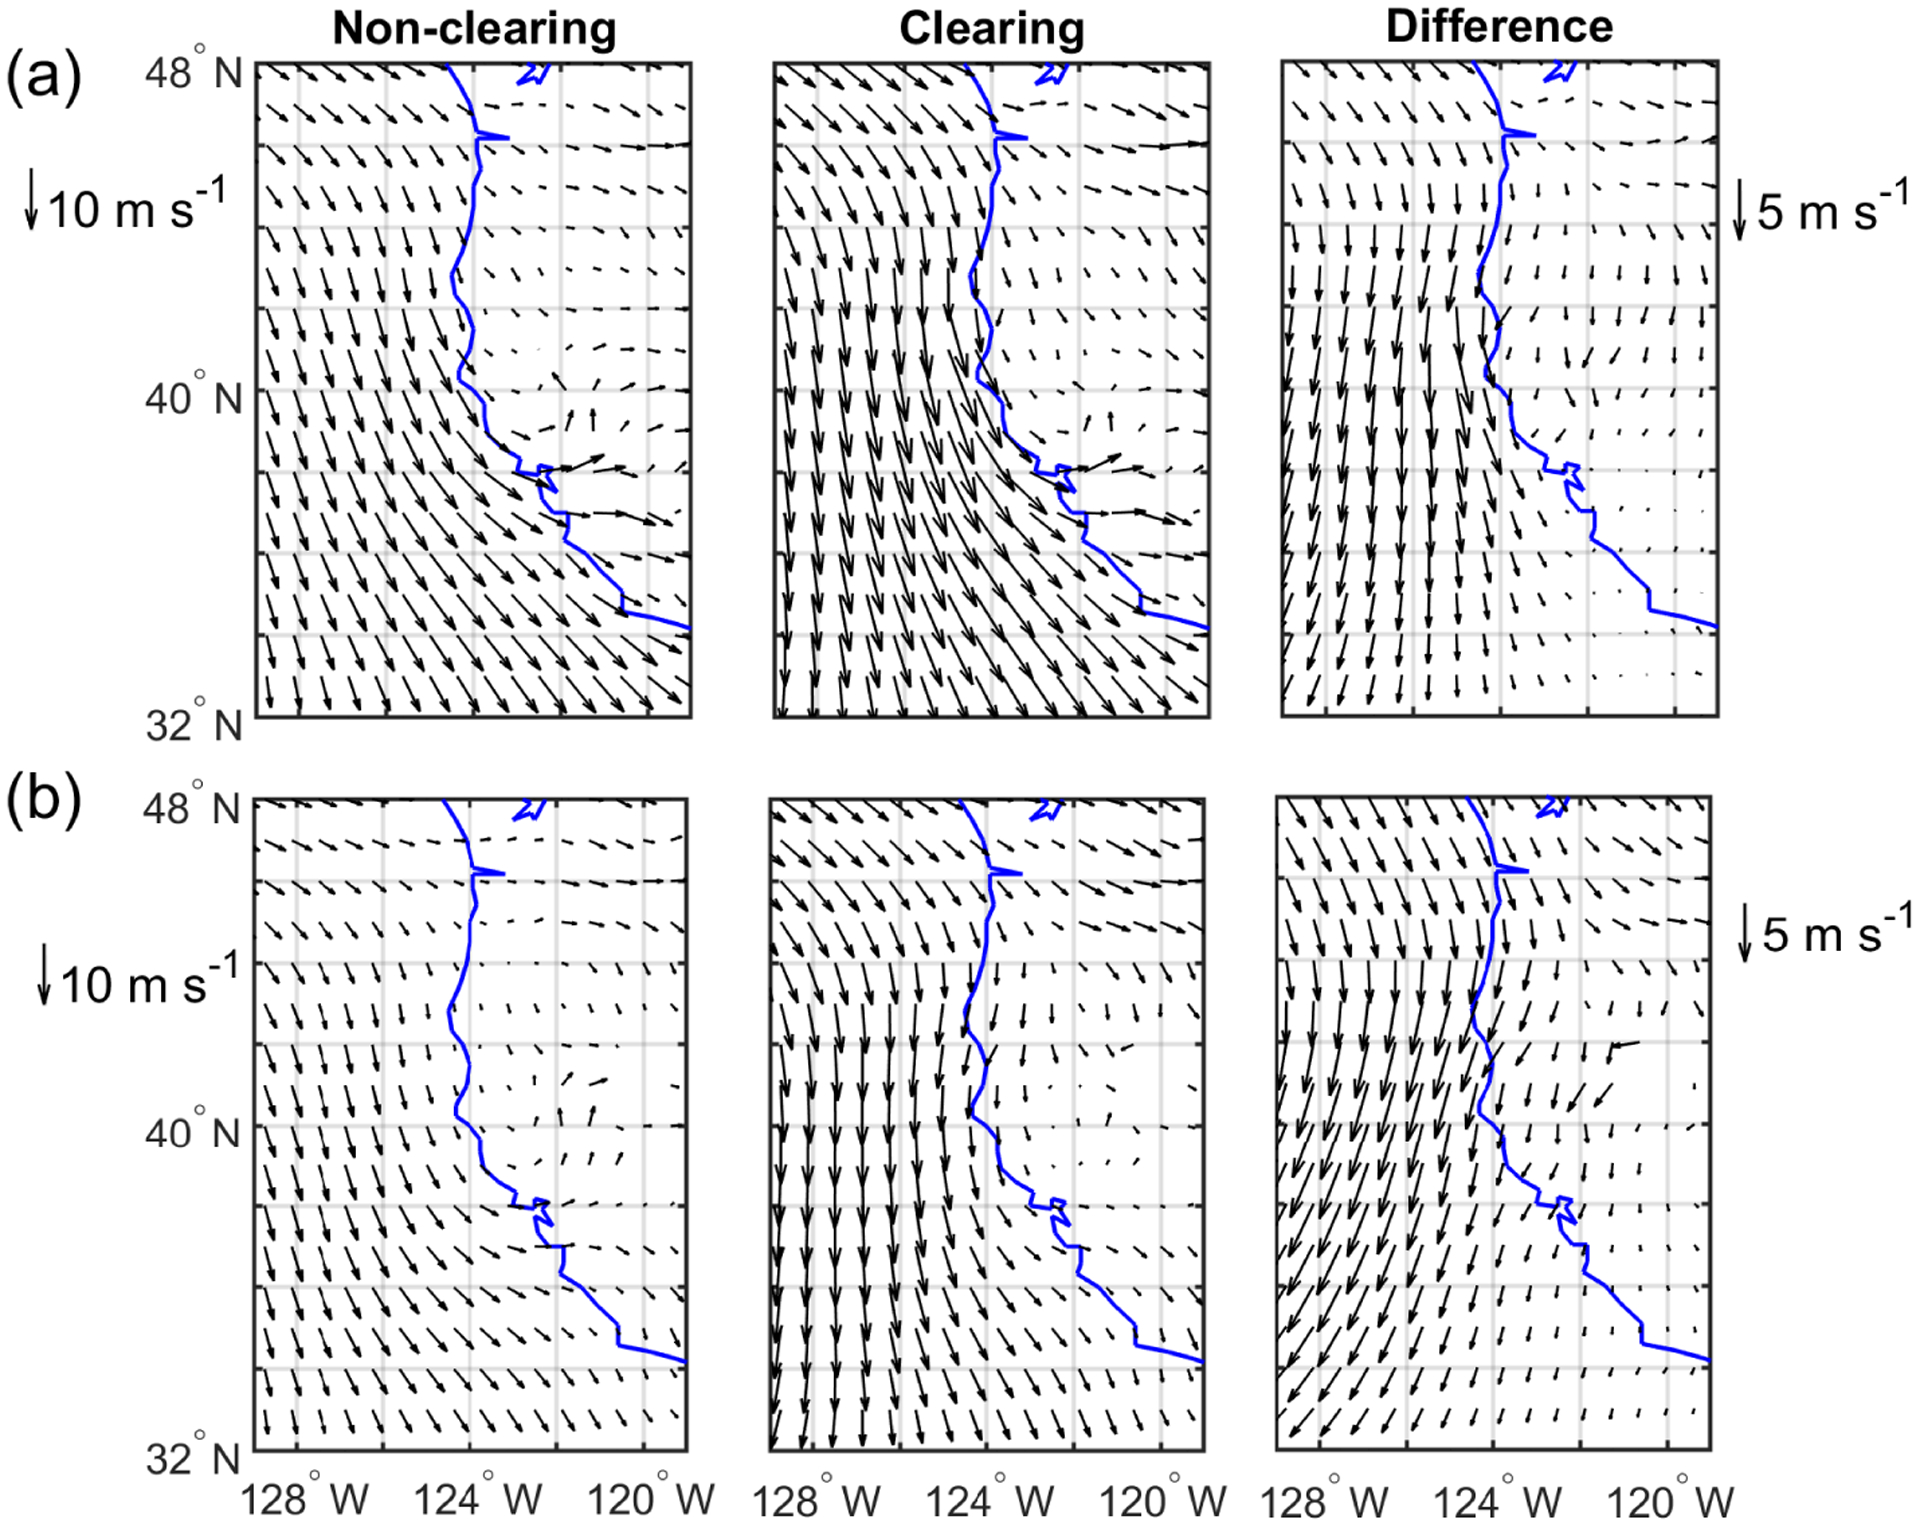
Figure 7.

Same as Fig. 6 but for wind speed at the (a) surface and (b) 850 hPa. Reference wind vectors are shown on the far left for the left two columns, with separately defined vectors on the far right for the difference (clearing minus non-clearing) plots in the farthest-right column.
