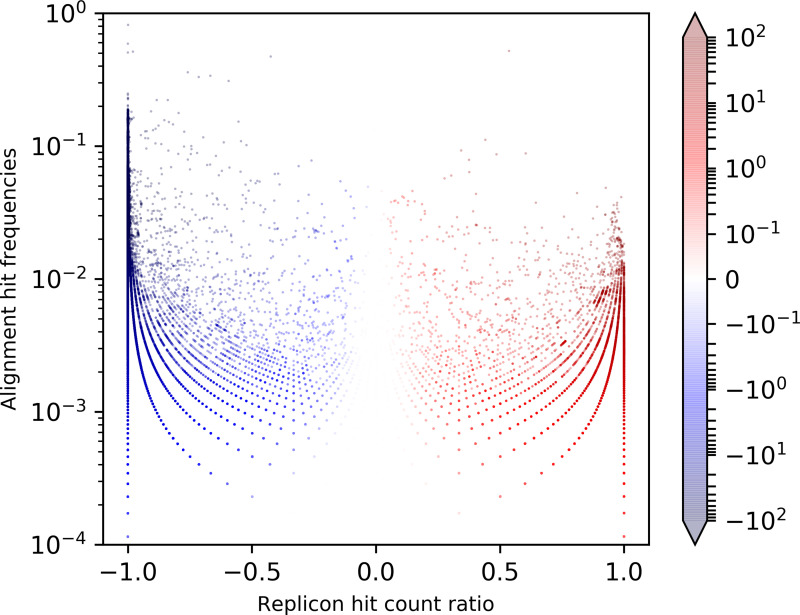
Fig. 2.
Replicon distribution and alignment hit frequencies of marker protein sequences. Shown here are summed plasmid and chromosome alignment hit frequencies per marker protein sequence plotted against plasmid/chromosome hit count ratios scaled to [−1, 1]; Hue: normalized replicon distribution score values (min=−100, max=100), hit count outliers below 10−4 and above 1 are discarded for the sake of readability.

