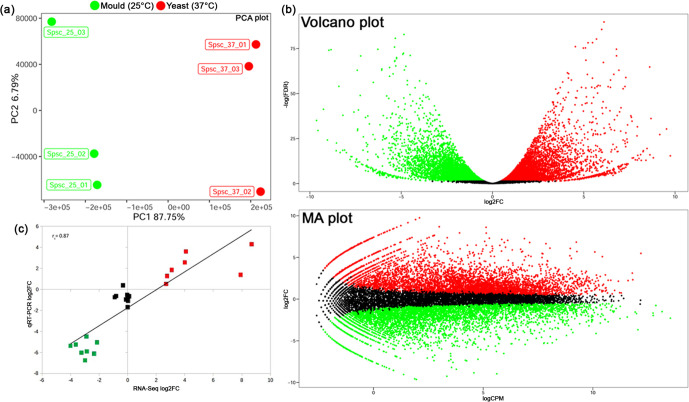
Fig. 5.
Sample variability, validation of RNA-seq data by qRT-PCR and differential gene expression between yeast and mould samples of S. schenckii examined in this study. (a) Principal component analysis (PCA) plot showing transcriptional profiles of S. schenckii cells grown at 25 °C (SSC_1–3 green) and 37 °C (SSC_4–6 red). The two groups are visually well-separated by the PC1 dimension and there is only a minor variation among the biological replicates as evidenced by the tenfold smaller scale for dimension PC2 compared to PC1. (b) Volcano plot and MA plot displaying differential gene expression between yeast and mould forms of S. schenckii. Significantly up-regulated and down-regulated genes in yeast cells compared with mould cells are indicated by red and green dots, respectively. Black dots indicate genes with no significant differences in their expression levels between the two tested conditions. (c) Scatter plot showing the correlation between RNA-seq and qRT-PCR expression data for 24 selected genes. The log2FC value is displayed for both RNA-seq data, as obtained from edgeR software, and qRT-PCR results, obtained from log2(2−ΔΔCt). The Spearman’s correlation coefficient rs is displayed. Squares denote up-regulated (red), down-regulated (green) and not regulated (black) genes.

