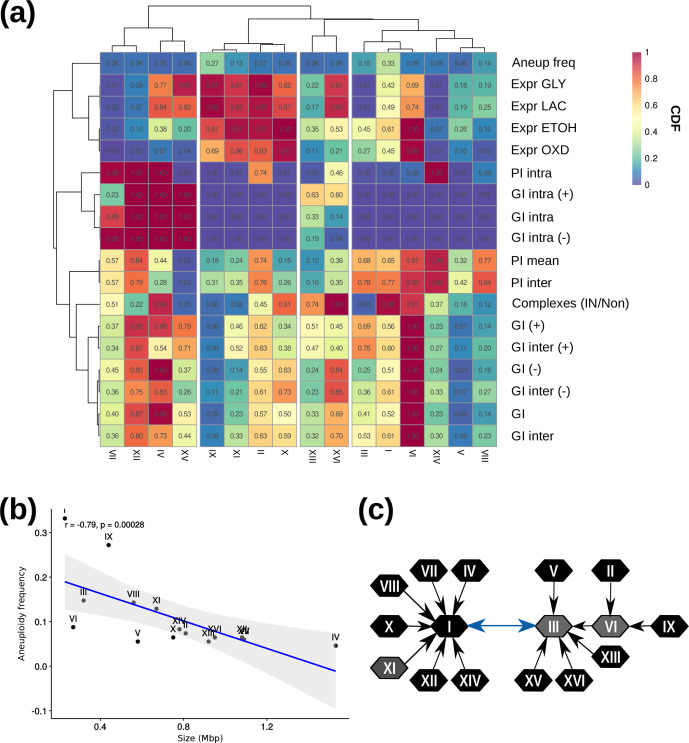
Fig. 5.
Factors affecting chromosome aneuploidy. (a) CDF value heatmap of the characteristics analysed for each chromosome and its aneuploidy frequency. Values near to one indicate a higher than expected mean and near to zero a lower than expected mean. Aneup freq, aneuploidy frequency; PI intra, intra-chromosomal physical interactions; GI intra (+), positive intra-chromosomal genetic interactions; GI intra, intra-chromosomal genetic interactions; GI intra (−), negative intra-chromosomal genetic interactions; Expr GLY, expression on glycerol; Expr LAC, expression on lactate; Expr ETOH, expression on ethanol; Expr OXD, expression on oxaloacetate; PI mean, mean physical interactions; PI inter, inter-chromosomal physical interactions; GI (+), positive genetic interactions; GI inter (+), positive inter-chromosomal genetic interactions; GI, genetic interactions; GI (−), negative genetic interactions; GI inter, inter-chromosomal genetic interactions; GI inter (−), negative inter-chromosomal genetic interactions; Complexes (IN/Non), proteins being in a complex or not. (b) Aneuploidy frequency of the chromosomes compared to the chromosome size. (c) Less interacting chromosomes network. The arrow between chromosomes represents the chromosome with which the interaction tends to be neutral.

