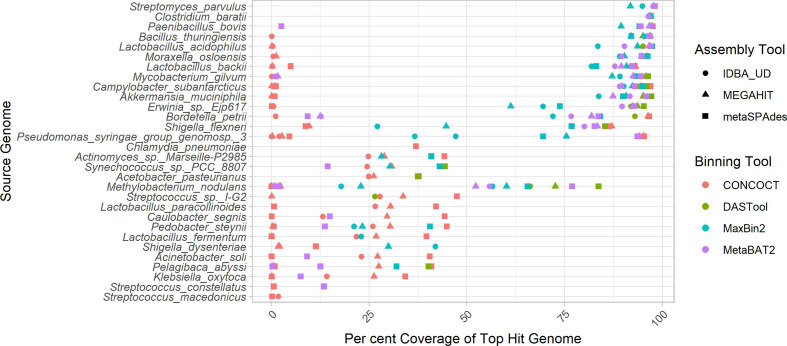
Fig. 1.
Top genome coverage for input genomes across MAG binners. Each dot represents the coverage of a specified genome when it comprised the plurality of the sequences in a bin. If a genome did not form the plurality of any bin for a specific binner-assembler pair, no dot was plotted for that genome and binner-assembler. The binning tool is indicated by the colour of the dot as per the legend. Genomes such as Clostridium baratii were accurately recovered across all binner-assembler combinations, whereas genomes such as Streptococcus macedonicus were systematically poorly recovered.

