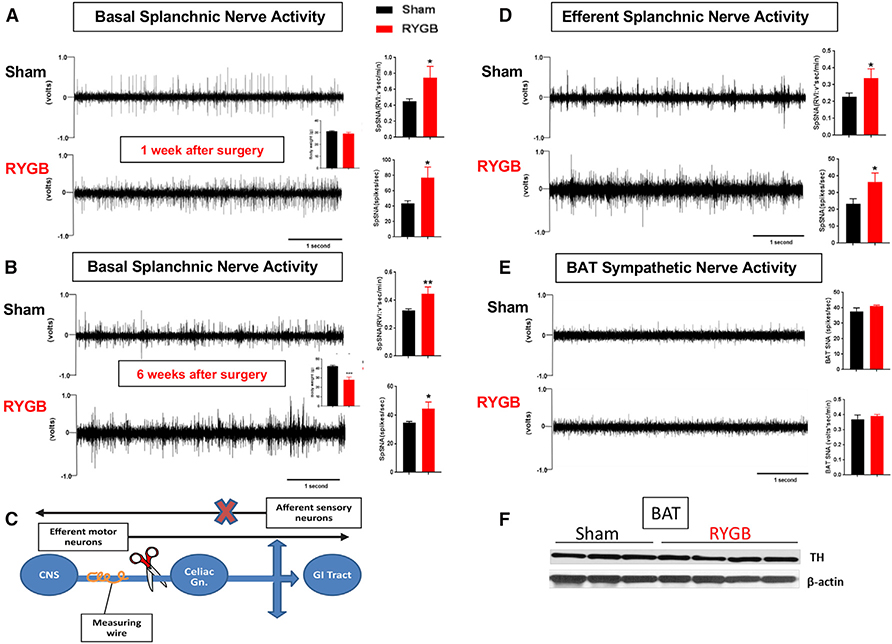
Figure 3. Increase in SNA of the Small Intestine after RYGB.
(A and B) Direct multi-fiber recording of basal splanchnic sympathetic nerve activity (SpSNA), expressed as volts*s/min or spikes/s in DIO mice 1 week (A) and 6 weeks (B) after RYGB (quantification in the adjacent graph).
(C) Schematic illustration of acute “de-afferentation” (i.e., elimination of afferent neuron fibers) as performed to measure the activity of the sympathetic efferent fibers of the splanchnic nerve.
(D) Direct recording of the activity of the splanchnic efferent fibers in RYGB- and sham-operated mice measured 60 min after acute “de-afferentation” of the greater splanchnic nerve causing loss of the afferent sensory fibers (quantification in the adjacent graph).
(E) BAT SNA (expressed in RVI = volts*s/min and in frequency = spikes/s) in RYGB- and sham-operated mice (6 weeks after surgery) (quantification in the adjacent graph).
(F) TH expression assessed by western blot in BAT of RYGB- and sham-operated DIO mice (6 weeks after surgery). Mean ± SEM. Sham n = 5–6, RYGB n = 5–6. *p < 0.05, **p < 0.01 RYGB versus sham by t test.

