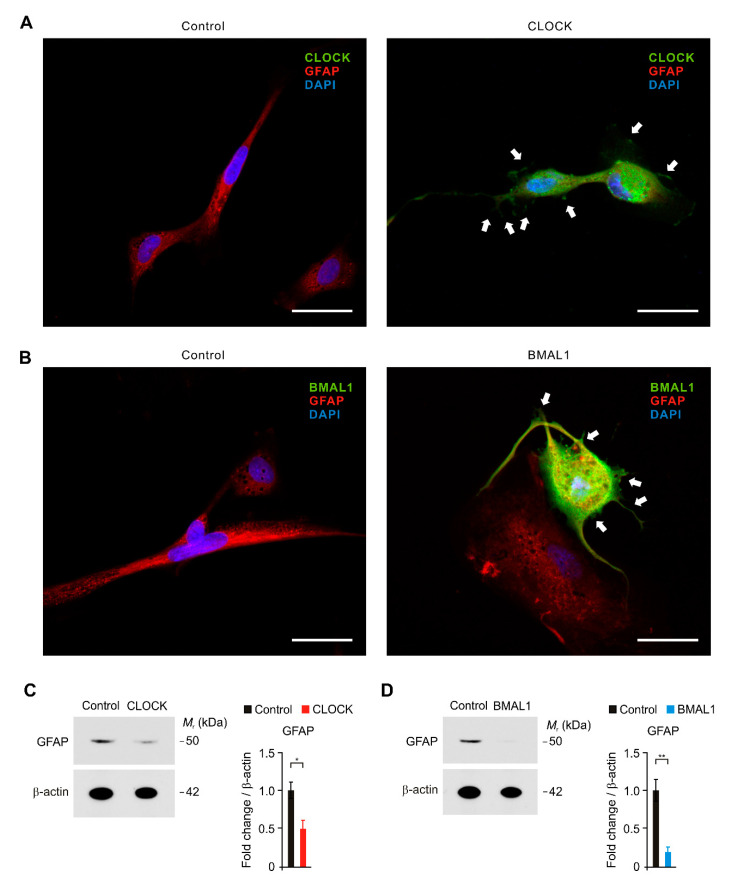
Figure 3.
The elevation of CLOCK and BMAL1 contributes to the functional impairment by reduction in GFAP-positive filaments in human astrocytes. (A) Representative immunofluorescence images of CLOCK expression in control and CLOCK-overexpressing (CLOCK) human astrocytes showing CLOCK (green) and GFAP (red) (n = 10 per group). DAPI-stained nuclei are shown in blue. The shortness and shrinkage of GFAP-positive filaments were indicated (white arrows). Scale bars, 20 μm. (B) Representative immunofluorescence images of BMAL1 expression in control and BMAL1-overexpressing (BMAL1) human astrocytes showing BMAL1 (green) and GFAP (red) (n = 10 per group). DAPI-stained nuclei are shown in blue. The shortness and shrinkage of GFAP-positive filaments were indicated (white arrows). Scale bars, 20 μm. (C) Representative immunoblot analysis for GFAP (left) and quantification for GFAP protein levels (right) in control and CLOCK-overexpressing (CLOCK) human astrocytes. For immunoblots, β-actin was used as loading control. Data are representative of three independent experiments. Data are mean ± SEM. * p < 0.05 using the two-tailed Student’s t-test. (D) Representative immunoblot analysis for GFAP (left) and quantification for GFAP protein levels (right) in control and BMAL1-overexpressing (BMAL1) human astrocytes. For immunoblots, β-actin was used as loading control. Data are representative of three independent experiments. Data are mean ± SEM. * p < 0.05, ** p < 0.01 using the two-tailed Student’s t-test.

