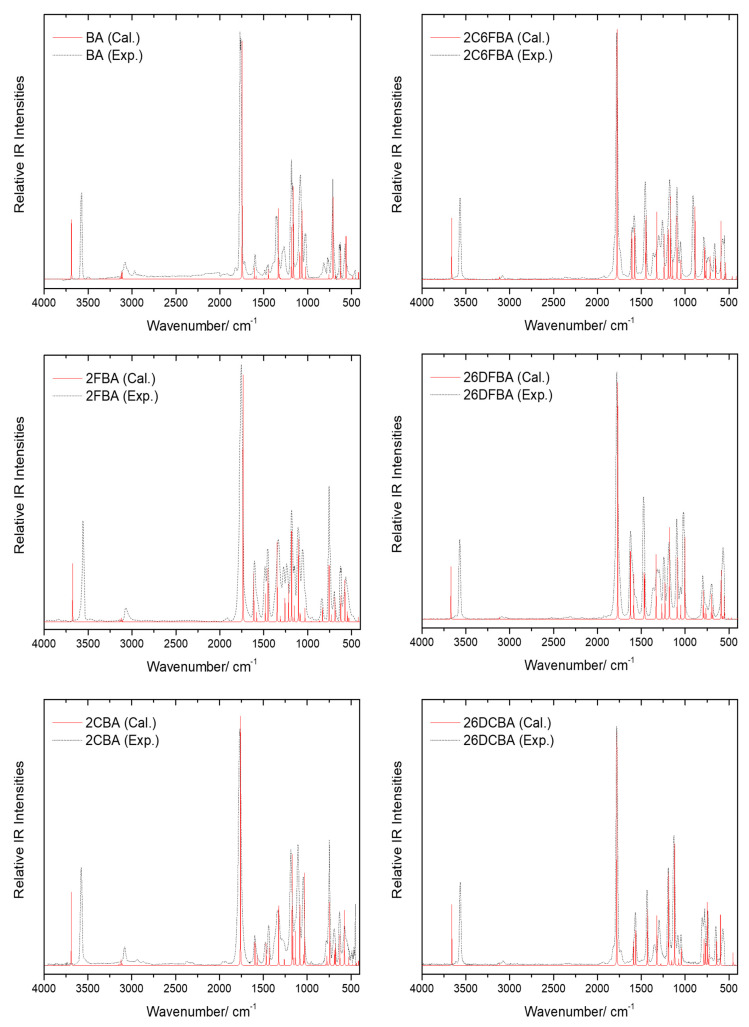
Figure 13.
Gas phase infrared spectra of the studied compounds (black dashed traces) and B3LYP/6-311++G(d,p) calculated infrared spectra for their experimentally relevant conformers (red traces), in the 4000–450 cm−1 region. Calculated frequencies are scaled by 0.978. For simplicity, only the calculated spectra for the most stable conformers of 2FBA (cis-II) and 2CBA (cis-I) are shown in the figure (see also text).

