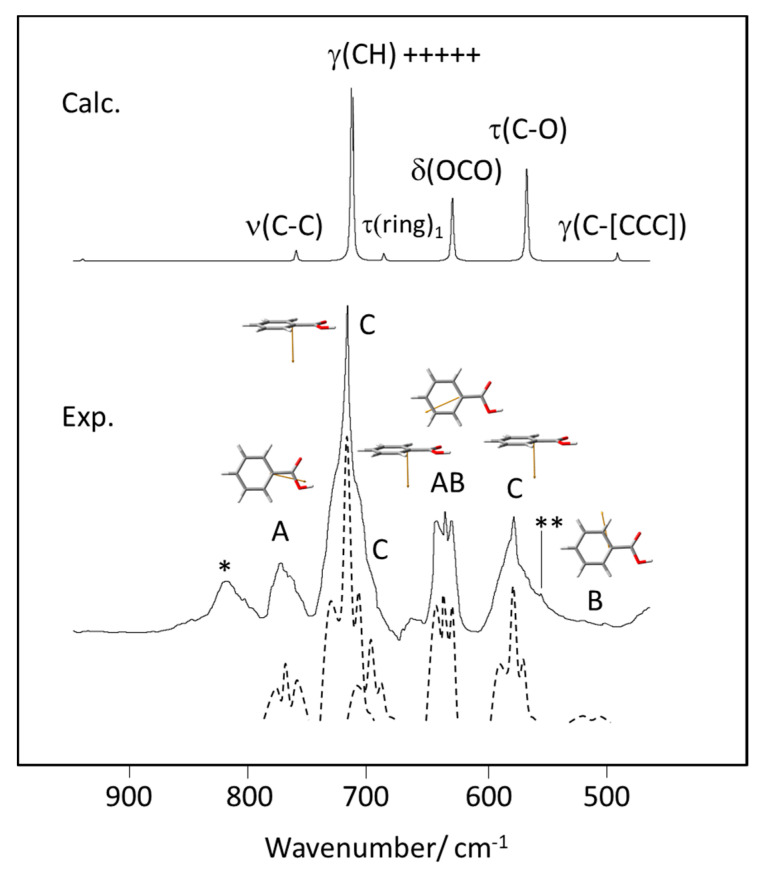
Figure 14.
900–450 cm−1 spectral region of the experimental (Exp.) gas phase infrared spectrum of benzoic acid, with indication of the band contour type (A, B, AB, C). The dashed figures are approximate deconvolutions of the experimental bands, drawn with increased resolution to highlight the characteristic bands profiles. The calculated (Calc.) spectrum is shown at the top of the figure, with indication of the band assignments. The drawings of the molecule show the the transition dipole moments (in orange color) for the different vibrations (see Figure 12 for orientation of the principal axes of inertia of the molecule). *-band due to an unknown impurity; **-band due to the combination tone τ(ring)3 + w(COOH) (calculated values: 404 + 155 = 559 cm−1 (see Table 2).

